Fig. 11.
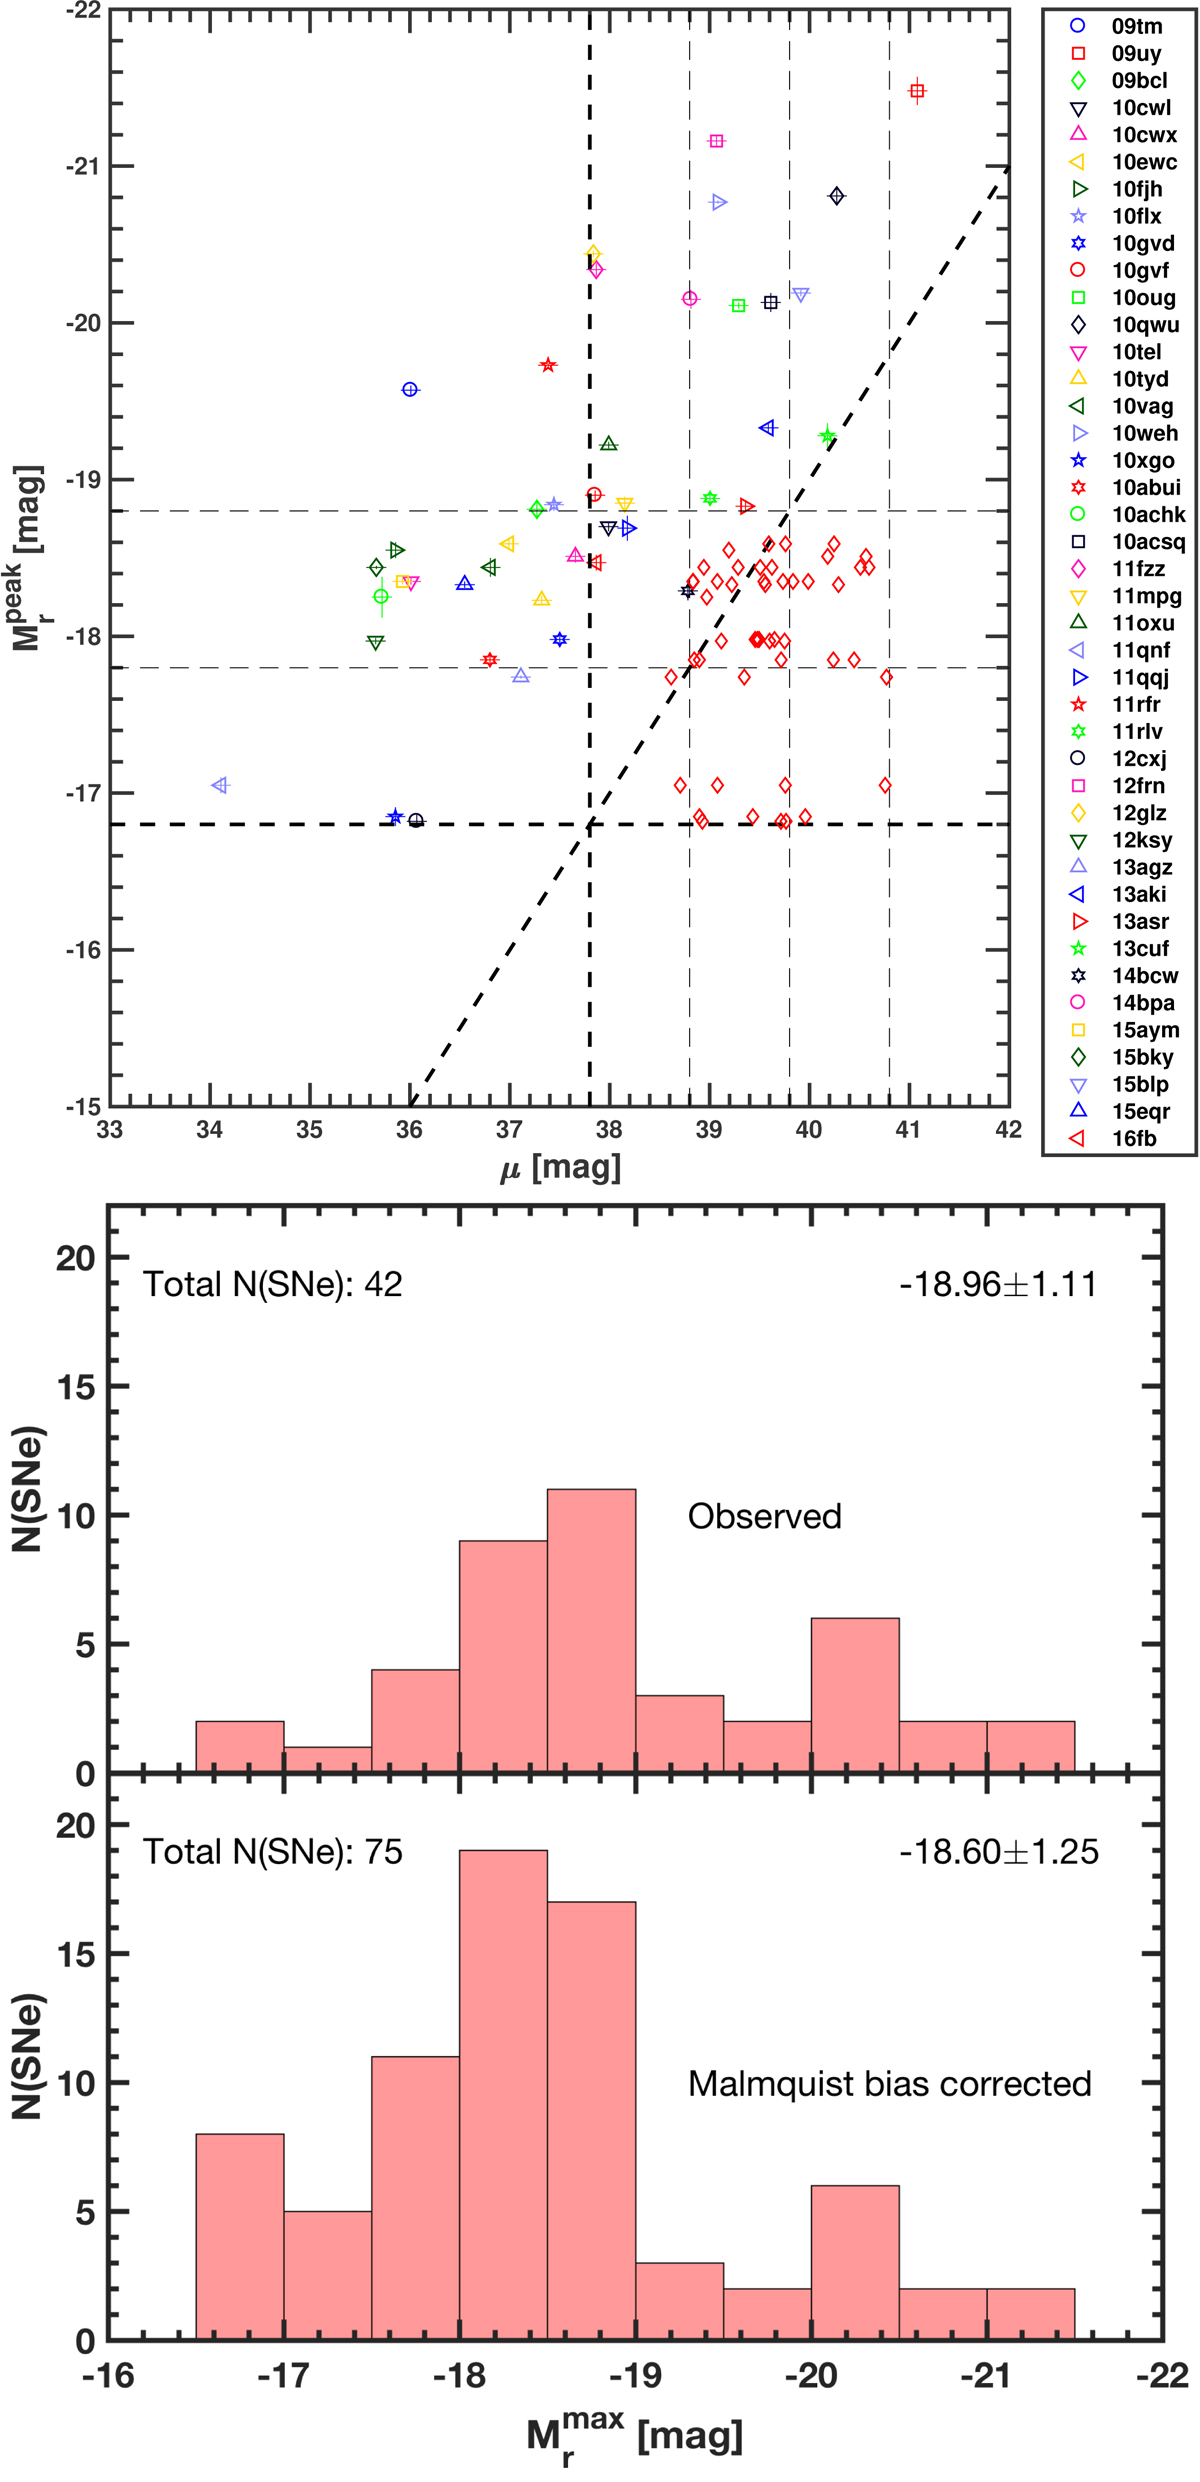
Top panel: peak absolute magnitude (![]() ) as a function of distance modulus (μ) of the 42 SNe in the sample, shown with the randomly generated SNe IIn (empty red diamonds) introduced to compensate for Malmquist bias. The limiting magnitude m = 21 typical for PTF/iPTF under favourable conditions is shown as a diagonal, dashed line. Vertical and horizontal dashed lines show
) as a function of distance modulus (μ) of the 42 SNe in the sample, shown with the randomly generated SNe IIn (empty red diamonds) introduced to compensate for Malmquist bias. The limiting magnitude m = 21 typical for PTF/iPTF under favourable conditions is shown as a diagonal, dashed line. Vertical and horizontal dashed lines show ![]() and μ intervals described in Sect. 4.6. Bottom panel: histograms of the observed and bias-compensated luminosity distributions of the SNe IIn at peak brightness. Bias compensation follows Richardson et al. (2014) and Taddia et al. (2019). K-corrections are not taken into account in the results plotted here, but are studied in Sect. 4.6.
and μ intervals described in Sect. 4.6. Bottom panel: histograms of the observed and bias-compensated luminosity distributions of the SNe IIn at peak brightness. Bias compensation follows Richardson et al. (2014) and Taddia et al. (2019). K-corrections are not taken into account in the results plotted here, but are studied in Sect. 4.6.
Current usage metrics show cumulative count of Article Views (full-text article views including HTML views, PDF and ePub downloads, according to the available data) and Abstracts Views on Vision4Press platform.
Data correspond to usage on the plateform after 2015. The current usage metrics is available 48-96 hours after online publication and is updated daily on week days.
Initial download of the metrics may take a while.