Fig. 10.
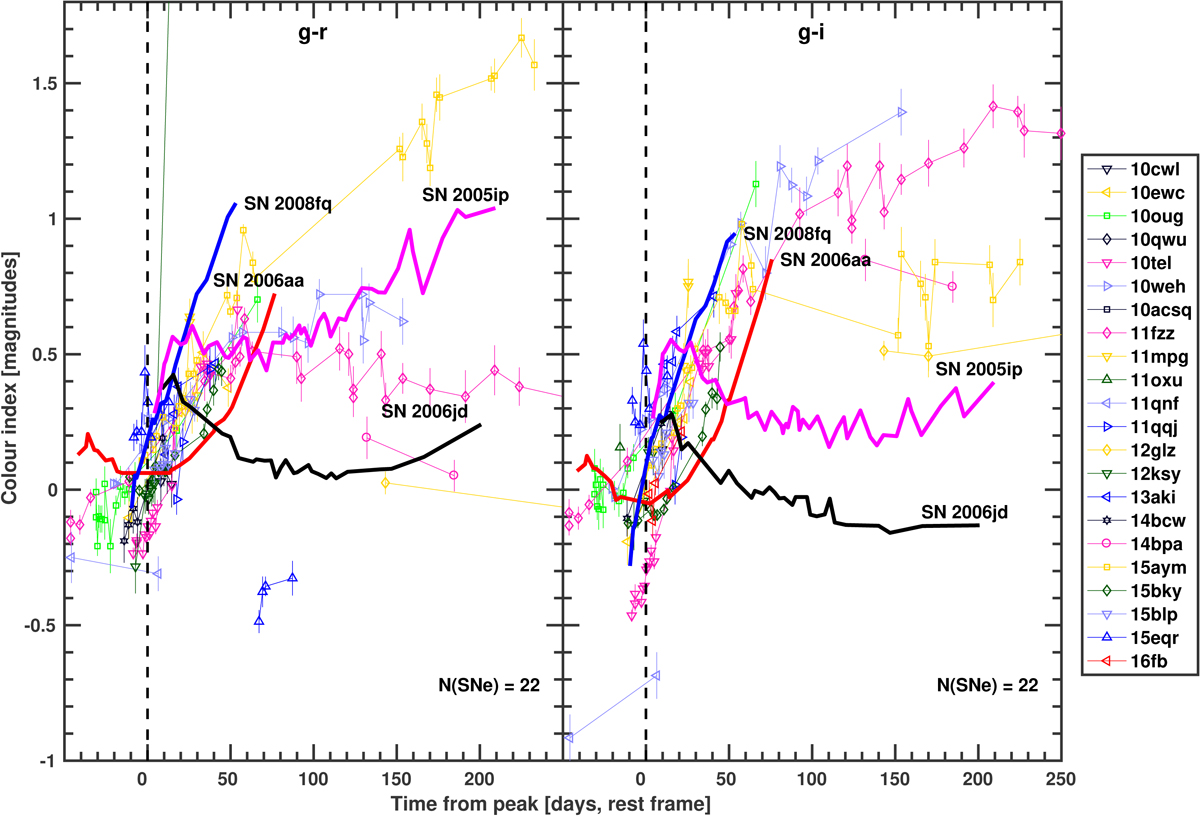
Evolution of g − r and g − i colours for 22 SNe in the sample. Host and MW extinction have been removed (Sect. 3). The vertical black dashed line shows the light-curve peak epoch (Sect. 4.1). Lines are drawn between data points to guide the eye. For clarity, colour data points with uncertainties > 0.1 mag are not shown. For comparison, SNe IIn 2005ip, 2006jd (Stritzinger et al. 2012), 2006aa, and 2008fq (Taddia et al. 2013) have their colour curves shown with bold lines.
Current usage metrics show cumulative count of Article Views (full-text article views including HTML views, PDF and ePub downloads, according to the available data) and Abstracts Views on Vision4Press platform.
Data correspond to usage on the plateform after 2015. The current usage metrics is available 48-96 hours after online publication and is updated daily on week days.
Initial download of the metrics may take a while.