Free Access
Fig. 1.
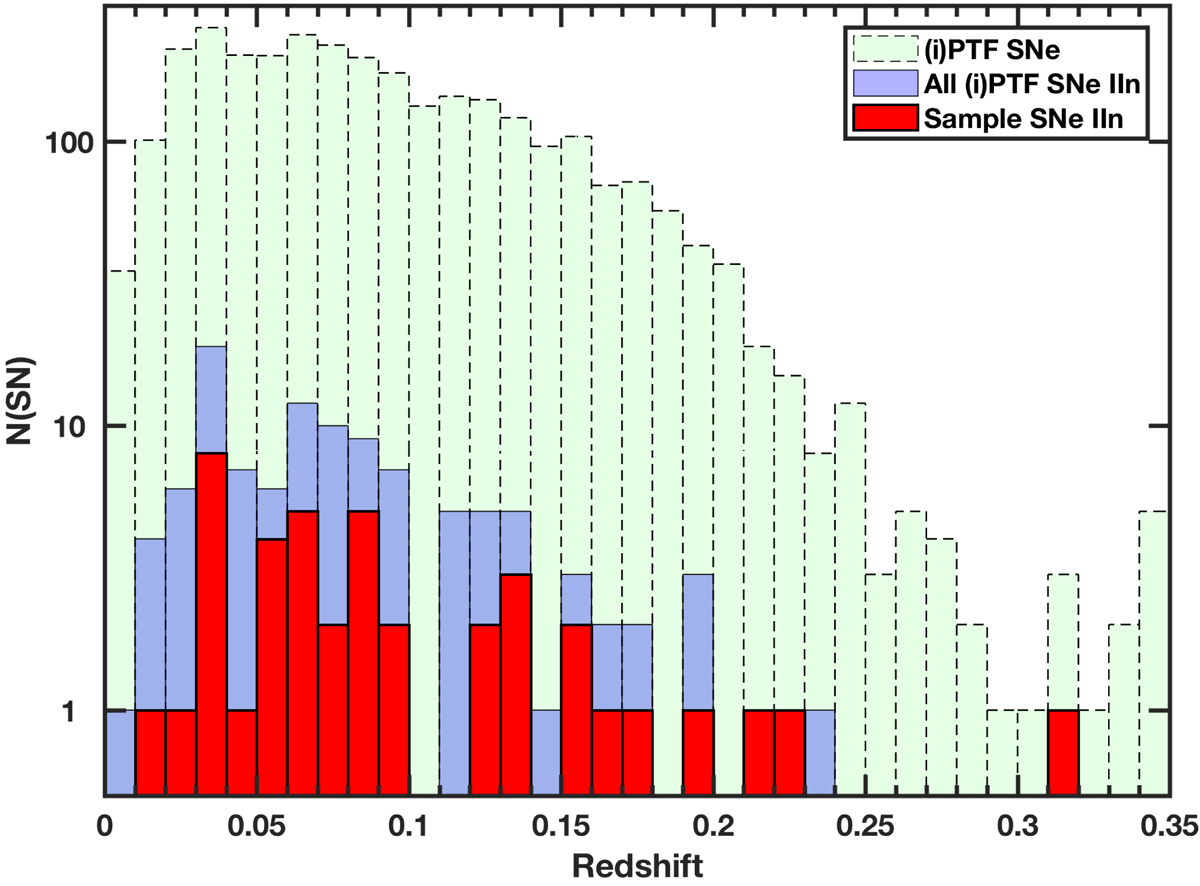
Histogram of redshifts for the 42 SNe IIn included in our sample, shown in red. The redshifts of the full PTF/iPTF sample of 111 SNe IIn is shown in blue. For comparison, the redshifts of the full PTF/iPTF yield of spectroscopically classified SNe (for z < 0.35) is shown in green.
Current usage metrics show cumulative count of Article Views (full-text article views including HTML views, PDF and ePub downloads, according to the available data) and Abstracts Views on Vision4Press platform.
Data correspond to usage on the plateform after 2015. The current usage metrics is available 48-96 hours after online publication and is updated daily on week days.
Initial download of the metrics may take a while.