| Issue |
A&A
Volume 637, May 2020
|
|
|---|---|---|
| Article Number | A2 | |
| Number of page(s) | 7 | |
| Section | Stellar structure and evolution | |
| DOI | https://doi.org/10.1051/0004-6361/201935720 | |
| Published online | 30 April 2020 | |
Broad-band spectral energy distribution of the X-ray transient Swift J1745−26 from outburst to quiescence⋆
1
Université de Paris, AIM, 91191 Gif-sur-Yvette, France
e-mail: This email address is being protected from spambots. You need JavaScript enabled to view it.
2
AIM, CEA, CNRS, Université Paris-Saclay, 91191 Gif-sur-Yvette, France
3
Université de Paris, CNRS, APC, 75013 Paris, France
4
Instituto de Astrofísica de Canarias, Universidad de La Laguna, Dpto. Astrofísica, 38206 La Laguna, Tenerife, Spain
Received:
17
April
2019
Accepted:
5
March
2020
Abstract
Aims. We aim to analyse our study of the X-ray transient Swift J1745−26, using observations obtained from its outburst in September 2012, up to its decay towards quiescence in March 2013.
Methods. We obtained optical and infrared observations, through override programme at ESO/VLT with FORS2 and ISAAC instruments, and added archival optical (VLT/VIRCAM), radio and X-ray (Swift) observations, to build the light curve and the broad-band spectral energy distribution (SED) of Swift J1745−26.
Results. We show that, during its outburst and also during its decay towards quiescence, Swift J1745−26 SED can be adjusted, from infrared up to X-rays, by the sum of both a viscous irradiated multi-colour black body emitted by an accretion disc, and a synchrotron power law at high energy. In the radio domain, the SED arises from synchrotron emission from the jet. While our SED fitting confirms that the source remained in the low/hard state during its outburst, we determine an X-ray spectral break at frequency 3.1 ≤ νbreak ≤ 3.4 × 10¹⁴ Hz, and a radio spectral break at 1012 Hz ≤ νbreak ≤ 1013 Hz. We also show that the system is compatible with an absorption AV of ∼7.69 mag, lies within a distance interval of D ∼ [2.6 − 4.8] kpc with an upper limit of orbital period Porb = 11.3 h, and that the companion star is a late spectral type in the range K0–M0 V, confirming that the system is a low-mass X-ray binary. We finally plot the position of Swift J1745−26 on an optical-infrared – X-ray luminosity diagram: its localisation on this diagram is consistent with the source staying in the low-hard state during outburst and decay phases.
Conclusions. By using new observations obtained at ESO/VLT with FORS2 and ISAAC, and adding archival optical (VLT/VIRCAM), radio and X-ray (Swift) observations, we built the light curve and the broad-band SED of Swift J1745−26, and we plotted its position on an optical-infrared – X-ray luminosity diagram. By fitting the SED, we characterized the emission of the source from infrared, via optical, up to X-ray domain, we determined the position of both the radio and X-ray spectral breaks, we confirmed that it remained in the low-hard state during outburst and decay phases, and we derived its absorption, distance interval, orbital period upper limit, and the late-type nature of companion star, confirming Swift J1745−26 is a low-mass X-ray binary.
Key words: accretion / accretion disks / black hole physics / dust / extinction / infrared: stars / X-rays: binaries
Based on observations collected at the European Organisation for Astronomical Research in the Southern Hemisphere under ESO programmes 089.D-0191 and 090.D-077 (PI Chaty).
© S. Chaty et al. 2020
 Open Access article, published by EDP Sciences, under the terms of the Creative Commons Attribution License (https://creativecommons.org/licenses/by/4.0), which permits unrestricted use, distribution, and reproduction in any medium, provided the original work is properly cited.
1. Introduction
Soft X-ray transients (SXT) are low-mass X-ray binary systems (LMXB), composed of a low-mass (M ≤ 1 M⊙) star and a compact object, either a neutron star or a black hole (see Chaty 2013). These systems spend most of their lives in quiescence (typically years to decades) when their X-ray luminosity is very low (LX ∼ 1031 erg s−1, i.e. well below the Eddington luminosity; Gallo et al. 2012). From time to time, they exhibit violent outbursts at all wavelengths, which evolve on short timescales of days (or even less). During these outbursts, matter from the star is accreted onto the compact object, via Roche-Lobe overflow and accumulation in an accretion disc, reaching bright X-ray luminosities up to LX ∼ 1038 − 39 erg s−1. The behaviour of SXT in both radio and X-rays is well described by a unified model (Fender 2010). A typical outburst is characterised by a fast rise in luminosity, with hard X-ray emission dominated by a hot inner accretion disc and synchrotron emission coming from a radio jet (low/hard state), followed by an exponential decay, until the stellar emission begins to be revealed in the optical and infrared (OIR), and eventually the jet disappears (high/soft state).
One such source is the transient black-hole candidate Swift J174510.8−262411 (Swift J1745−26 hereinafter), discovered by Swift/BAT (15−50 keV) on September 16, 2012 (MJD 56186.39, Cummings et al. 2012a) and detected by Swift/XRT (0.2−10 keV, Cummings et al. 2012b), located at RA (J2000) =  , Dec (J2000) =
  . The flux increase was similar to those observed in black-hole transients. It was classified as a failed transition, since it did not reach the soft state (Belloni et al. 2012). Following the outburst rise, the source remained in the hard state (Tomsick et al. 2012; Sbarufatti et al. 2013), and it changed to hard/intermediate state in MJD 56370 (Belloni et al. 2012), showing a slightly steeper spectrum. A secondary flare was detected in optical and X-rays on MJD 56380 (Russell et al. 2013). The outburst remained observable until June 2013. Follow-up observations in the optical confirmed the presence of a double-peaked Hα line, characteristic of black-hole transients (de Ugarte Postigo et al. 2012; Tomsick et al. 2012). It was proposed that Swift J1745−26 be classified as an LMXB, with a companion star of spectral type later than A0 and orbital period of less than 21 h (Muñoz-Darias et al. 2013). Radio and sub-millimetre (sub-mm) observations performed with VLA, SMA, and JCMT in September 2012 revealed a power law with inverted spectral index α ∼ 0.07 − 0.17 (Tetarenko et al. 2015). The outburst decay was well studied in optical and X-ray wavelengths by Kalemci et al. (2014), who concluded that the X-ray spectra were consistent with thermal Comptonization, without ruling out a jet synchrotron origin with a high-energy cutoff at 112 keV.
We triggered observations of Swift J1745−26 at ESO at two different epochs, the first one during its outburst rise in September 2012, and the second one in March 2013 as soon as it was observable again, corresponding to its decay towards quiescence. In the following work, we present our study of Swift J1745−26: we describe the observations in Sect. 2, the results in Sect. 3, the discussion in Sect. 4, and the outcomes in Sect. 5.
2. Observations
We now describe the observations we performed on the source Swift J1745−26.
2.1. VLT/FORS2 and ISAAC photometric observations
We triggered two sets of observations of Swift J1745−26: firstly from September 18, 2012 (ESO ID 089.D-0191, PI Chaty, two nights after the Swift/BAT discovery alert), lasting (with uneven sampling) until September 25, 2012; and the second from March 06 to 13, 2013 (ESO ID 090.D-077, PI Chaty), covering the decay towards quiescence.
We performed observations with Unit Telescope 1 (UT1) of the Very Large Telescope (VLT) in the OIR domain. Optical observations were carried out with the FORS2 instrument, covering the 0.33 − 1.10 μm band using U (identified as u-HIGH, λ = 0.365 μm), B (b-HIGH, λ = 0.437 μm), V (v-HIGH, λ = 0.555 μm), R (R-special, λ = 0.655 μm), and I (I-BESS, λ = 0.768 μm) filters. For the infrared observations we used the ISAAC instrument, covering the band between 1 − 2.5 μm, using the filters Js (λ = 1.240 μm), H (λ = 1.664 μm), and Ks (λ = 2.164 μm). Air masses were always between 1.03 and 1.40.
All optical and infrared data were reduced using standard IRAF routines, with bias and flat-field correction (Tody 1986, 1993). In addition, the contribution from the thermal sky emission was removed from the infrared data, by pointing at different positions in the sky, that we combined through median-filter to produce a blank thermal sky, which was then removed from our data. The obtained fluxes were calibrated with those of standard stars: PG2213-B and E7-S6 for September 2012, FS121 and E7-S6 for March 2013.
In Table 1, we report our photometry results for both data sets (September 2012 and March 2013, respectively). The OIR light curve is shown in Fig. 1, overplotted with the X-ray Swift light curve in order to show the state of the source during its outburst rise, and its decline towards quiescence, respectively. The general trend shows that both OIR and X-ray fluxes decrease from September 2012 to March 2013, indicating that Swift J1745−26 exhibits high activity during the first epoch, decaying towards quiescence during the second epoch.
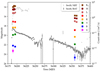 |
Fig. 1. Optical, infrared, and X-ray light curves of Swift J1745−26 during its 2012−2013 outburst. UBVRI and Js, H, Ks photometry come from the VLT/FORS2 and ISAAC observations, respectively. The high-energy Swift/BAT light curve comes from archival data. |
OIR photometry results of Swift J1745−26 during the 2012−2013 outburst, with the date (days, MJD) and apparent magnitudes for the different optical (u, b, v, R and I) and infrared (Js, H, and Ks) filters.
2.2. VLT/FORS2 spectroscopic observations
We also obtained 340–620 nm optical spectra of Swift J1745−26 with the FORS2 instrument on September 19, 2012, and March 06, 2013 (exposure time: 10 min, slit:  , grism: GRIS_600B, instrument mode: FORS2_lss_obs_off_fast). However, both spectra do not show any discernable spectral feature, so most likely emanate from the accretion disc emission, and/or a non-thermal synchrotron component.
2.3. VLT/VIRCAM observations
We retrieved a 12 × 4 s Ks band image acquired by ESO/VIRCAM on April 9, 2019 of the field around Swift J1745−26. The acquisition was performed under the VVV Extended ESO Public Survey (VVVX, programme # 198.B-2004(I)). Due to the tiling of the VIRCAM detector, the effective exposure time on the field around the source is 4 × 4 = 16 s. We do not detect the source at this epoch. The limiting Ks magnitude taken at 5σ above the background noise was computed at Ks = 18.2 mag (in the Vega system). As the source is in quiescence, we suggest that Ks(lim) = 18.2 mag can be taken as a lower limit for the apparent magnitude of the companion star. We show the VIRCAM 38″ × 38″ field of view around the position of Swift J1745−26 in Fig. 2.
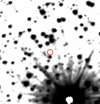 |
Fig. 2. VIRCAM 38″ × 38″ field of view, north to the top, east to the left, with a 1″ circle around the position of Swift J1745−26. |
3. Results
We use our OIR (VLT/FORS2 and ISAAC) measurements of September 2012 and March 2013, VIRCAM upper limit, and archival X-ray observations obtained at similar epochs by Swift/BAT (Sbarufatti et al. 2013; Kalemci et al. 2014) and Swift/XRT (Sbarufatti et al. 2012), to build an OIR-to-X-ray spectral energy distribution (SED) of Swift J1745−26, as shown in Fig. 3 (OIR in left panel and X-rays in right panel, respectively).
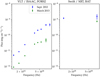 |
Fig. 3. Spectral energy distribution of VLT/ISAAC (infrared), FORS2 (optical) and Swift/XRT, BAT (soft and hard X-rays) data points of Swift J1745−26 during its 2012−2013 outburst. |
3.1. Modelling the spectral energy distribution
We fit this SED for both epochs independently. Swift J1745−26 being a (likely black hole) low-mass X-ray binary, we expect that its OIR thermal emission comes from the sum of an accretion disc and a late-type main sequence star. The high-energy emission detected by Swift likely arises from a corona, or from the base of a jet, around the compact object. We thus use three different contributions in our model: firstly, a multi-colour black-body acccretion disc; secondly, a cut-off power law for the black-hole corona and base of jet; and, thirdly, a standard black-body spectrum for the low-mass late-type stellar companion.
We adjust the OIR SED of both epochs with a viscous-irradiated disc model (Hynes et al. 2002), meaning a sum of a viscous multi-colour black-body spectrum (Shakura & Sunyaev 1973), with the corresponding modified temperature distribution of an irradiated disc (Cunningham 1976). The multi-colour black-body component is thus modeled as follows:
 (1)
(1)
with Bν the Planck function for black-body radiation:
 (2)
(2)
and T(r) the effective temperature at radius r:
 (3)
(3)
The temperature profiles due to viscous heating and irradiation are, respectively, defined as:
 (4)
(4)
This multi-colour black-body model uses six parameters: the inner radius Rin and outer radius Rout of the accretion disc, the viscous temperature Tv, the irradiated temperature Ti, the inclination angle i, and the distance D.
Concerning the high-energy emission, the X-ray spectrum is adjusted with a power law, defined by two parameters –the amplitude A and the spectral index E– to which we add a low-energy exponential cutoff at the frequency ν0, with the exponential decrease rate governed by the index P, influencing the speed at which the exponential cutoff happens. The equation for the power law (Eq. (5)), governed by the four parameters {A, E, ν0, P}, is written as:
 (5)
(5)
The amplitude A is normalised using the flux FA and frequency νA of the lowest energy Swift data point of 2012, September (1.22 × 10⁻⁹ erg s−1 cm−2 flux at 1.25 × 10¹⁸ Hz). This presents the advantage of having the amplitude A normalised, independently of the spectral index E and the exponential decrease rate P. Using this equation, the cutoff power-law value at ν0 is ∼1.7 times lower than the equivalent classical power law.
3.2. Extinction
In order to correct OIR magnitudes for interstellar reddening, we use the column density of Swift J1745−26, as measured in X-rays. Tomsick et al. (2012) derived a value of NH = (1.70 ± 0.04)×1022 cm−2 (on MJD 56188, during the rise of the outburst), while Kalemci et al. (2014) obtained NH = (2.18 ± 0.25)×1022 cm−2 (by fitting X-ray spectra taken for several nights from MJD 56334 to MJD 56435, during the decay). In this paper, we use the relationship between hydrogen column density –NH– and optical extinction –AV– in our Galaxy given by Güver & Özel (2009), based on pointed X-ray observations of a large sample of supernova remnants. We derive a total extinction of the system, assuming the two values of NH, respectively, of AV = 7.69 and 9.86 mag. In Fig. 4, we show the results of our fit for these two values of extinction. By taking the high level of absorption (AV = 9.86), the optical data are too bright to be fitted with both a multi-colour black-body disc and an X-ray power law. On the other hand, when choosing the low level of absorption (AV = 7.69), we can reasonably fit both the infrared and optical data by summing the multi-colour black-body disc with the X-ray power law. In the following, we therefore use the low level of absorption (AV = 7.69) to correct the data for interstellar redening. Considering RV = AV/E(B − V) = 3.1, we obtain the extinction coefficients for the other wavelengths (Cardelli et al. 1989): AB = 10.28, AR = 5.75, AI = 3.68, AJs = 2.17, AH = 1.46 and AKs = 0.88 mag.
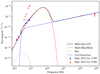 |
Fig. 4. SED of Swift J1745−26 from OIR to X-rays for September 2012 observations. The SED is built with data points de-reddened with an AV = 7.69 (blue points) and AV = 9.86 mag (red points), respectively. The result of the fit is plotted in black, adding the stellar black body (grey), the multi-colour black-body accretion disc (red), and the X-ray power law (blue). While it is impossible to fit the optical data points de-reddened with an AV of 9.86, a reasonable fit can be obtained with optical and infrared data points de-reddened with an AV of 7.69 mag. |
3.3. Distance
The distance can not be derived directly from SED fitting, thus we used the VIRCAM non-detection as an upper limit of the flux of Swift J1745−26 in quiescence, to derive the confidence interval on the distance for a black body corresponding to a companion star of a certain spectral type. We thus performed some preliminary fits to explore the space parameters, by interpolating the spectral type and the distance obtained, using the VIRCAM lower limit as an input. We find that spectral types earlier than K0, corresponding to distances higher than 4.8 kpc, give us disc temperatures higher than T ≥ 25 000 K, which we reject based on the highest disc temperature given in Hynes et al. (2002). Similarly, spectral types later than M0, located closer than 2.6 kpc, give us disc temperatures lower than T ≤ 1400 K, which we also reject based on the lowest disc temperature in Hynes et al. (2002). We thus find a valid distance interval D of the system comprised between 2.6 and 4.8 kpc, corresponding to a stellar spectral type interval of the companion star comprised between K0 and M0 V.
3.4. Orbital period and separation
From our photometric measurements, we can set further constraints on the orbital period of the system, following the method by Muñoz-Darias et al. (2013). The apparent magnitude in the R band during the outburst is Routburst = 18.4 ± 0.2 on MJD 56189. Hynes et al. (2012) determined that the magnitude in quiescence was Rquiescence ≥ 23.1 ± 0.5 mag. Taking the spectral type interval of [K0–M0] derived earlier, and the extinction, along with the Ks(lim) = 18.2 mag obtained from VIRCAM observations, we derive a new upper limit at Rquiescence ≥ 25.0 mag, more constraining than the one given by Hynes et al. (2012). Thus, we obtain ΔR = Rquiescence − Routburst ≥ 6.6 ± 0.2 mag. From Table 1, we assume that ΔR ∼ ΔV, since the trend is similar and the spectrum is disc dominated. We apply Formula (1) from Shahbaz & Kuulkers (1998), which provides an empirical relationship between the outburst amplitude and the orbital period of a system. We obtain an orbital period upper limit Porb ≤ 11.3 h, more constraining than the upper limit of Porb = 21 h proposed by Muñoz-Darias et al. (2013). Considering Formula (2) from Faulkner et al. (1972), the obtained orbital period upper limit implies an average density for the companion star of ρ > 1.21 g cm−3, corresponding to a spectral type F4 V or later (Kreiken 1953), in agreement with Muñoz-Darias et al. (2013), and consistent with the [K0–M0] spectral type interval. Hence, we confirm that Swift J1745−26 is an LMXB.
Finally, we need to know the size of the accretion disc, constrained between the inner radius Rin and the outer radius Rout. Assuming a mass of the (likely) black hole of 10 M⊙, we will fit Rin, defined as a multiple of the innermost stable circular orbit (ISCO):
 (6)
(6)
With a Roche lobe around the black hole equal to RL = 3.1 R⊙ (Eggleton 1983), we derive Rout = 0.9 × RL = 2.78 R⊙. Using the orbital period upper limit obtained above, we compute, assuming a circular orbit, an orbital separation of a ≤5.1 ± 1.9 R⊙. Finally, we assume a fixed inclination angle of i = 45°.
In the following, we present the results of our fits performed for a K5 V star (R = 0.72 R⊙, M = 0.67 M⊙, Teff = 4410 K, Allen 1973), right in the middle of the [K0–M0] spectral range, located at a distance of D = 3.5 kpc.
3.5. Fitting September 2012 SED
We are now able to fit the SED from September 2012, with the sum of a multi-colour black body and an X-ray power law. Initially, we performed multiple fits with parameters Tv and Ti free, but we obtained too much degeneracy with high uncertainties in the parameters, and a value of Tv that converged towards 0, indicative of a lack of observational constraint in the UV–X-ray range. We thus consider a disc dominated either by Tv or by Ti. Subsequently, we froze Tv = 0 and set Ti free, with the parameter Rin fixed within the range 1 − 30 000 ISCO to manually explore the parameter space. We find that we can achieve a best fit for Rin = 300 ISCO and Ti = 16 400 ± 700 K. Finally, we fixed Ti = 0 K and allowed Tv to be free, the fit converged towards Rin = 1600 ISCO and Tv = 13 500 ± 600 K. It is degenerate, but at least the high Rin value is consistent with the low-hard state. Even if the lack of high-energy data could potentially allow for a lower Rin, corresponding to a high-soft state, we favour a solution with high Rin, more consistent with a low-hard state expected at the beginning of the outburst. The only way to better constrain Rin would be to have data points within the EUV domain, which seems impossible considering the high extinction of this source (such EUV data had been obtained on XTE J1118+480, a microquasar that exhibited a very low extinction, see Chaty et al. 2003).
To summarise, we fixed five parameters {Rin, Rout, Ti, i, D} and included five free parameters {Tv, A, E, ν0, P}, with 10 data points, resulting in four degrees of freedom. All the results of our fits are reported in Table 2 and plotted in Fig. 5 (top panel, with the value of Rin = 1600 ISCO).
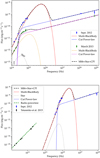 |
Fig. 5. Top panel: SED of Swift J1745−26 from OIR to X-rays, for September 2012 (blue points) and March 2013 (green points) observations. The SED is built with data points de-reddened with AV = 7.69. The result of the fit (plotted in black) is the sum of: multi-colour black body accretion disc (in red with Rin = 1600 ISCO for Sept. 2012, and in yellow with Rin = 2900 ISCO for March 2013, respectively), X-ray power law (blue for Sept. 2012 and pink for March 2013 resp.), and potentially stellar contribution (grey upper limit). Bottom panel: broad-band SED of Swift J1745−26 from radio to X-rays for September 2012 observations, including our best fit obtained by adjusting only infrared, optical to X-ray data points (with same colour coding and Rin = 1600 ISCO). For comprehensiveness, we also include radio data points reported in Tetarenko et al. (2015). |
Parameters obtained from fitting the September 2012 and March 2013 SED of Swift J1745−26, including ISAAC, FORS2, and Swift data (“f” means frozen).
3.6. Fitting March 2013 SED
For March 2013, on the declining part of the outburst, the multi-colour black-body component contributes less to the overall emission than in September. We added a single one-temperature black body resulting from stellar emission to the disc and X-ray power law. Since, for this date, there is no contemporaneous Swift/XRT observation, we extrapolated the single X-ray Swift/BAT measurement to optical data points.
We first performed multiple fits with parameters Tv and Ti free, but, as for September 2012, we obtain too much degeneracy in the fits, with high uncertainties in the obtained parameters, with Tv close to 0, again due to a lack of observational constraint in the UV–X-ray range. Then, we froze Tv = 0 and allowed Ti to be free, with the parameter Rin fixed within the range 1 − 30 000 ISCO to manually explore the parameter space. We find that we can achieve a best fit for Rin = 1300 ISCO and Ti = 4950 ± 70 K. Then, we froze Ti = 0 and left Tv as a free parameter, the fit converges towards Rin = 2900 ISCO, and Tv = 4240 ± 70 K. It is again degenerate, but consistent with the source still being in the low-hard state, with a higher value of Rin than in Sept. 2012, suggesting that the disc has been depleted, contributing less in OIR with the viscous temperature of the disc decreasing, consistent with the source declining towards quiescence.
In all our fits, the X-ray power law is better constrained than in September, and always converges towards the parameters reported in Table 2, and plotted in Fig. 5 (top panel), where we show the result for Rin = 2900 ISCO. There is no substantial difference between 2012 Sept. and 2013 March concerning the spectral index and cutoff frequency of the X-ray power law. To summarise, as for Sept. 2012 we fixed five parameters {Rin, Rout, Ti, i, D} and freed five parameters {Tv, A, E, ν0, P}, with nine data points, thus three degrees of freedom.
4. Discussion
In Fig. 5 (bottom panel), we show the broad-band SED corresponding to the September 2012 observations, with our infrared-to-X-ray fit, and we added radio observations reported by Tetarenko et al. (2015). The SED shows that the OIR contribution can be described by a viscous and/or irradiated multi-colour black-body disc model, the broad-band spectrum being compatible with the source being in the low/hard state. The maximum peak luminosity corresponds at this date to L ∼ 1.17 × 1037 erg s−1 (at a distance of 3.5 kpc), compatible with the mentioned state.
Tetarenko et al. (2015) proposed that the power law fitting of the radio/sub-mm data could be extrapolated to shorter wavelengths, including the optical i′-filter observations from Muñoz-Darias et al. (2013), placing a lower limit for the radio jet spectral break at either νbreak ≥ 2.3 × 10¹¹ Hz or νbreak ≥ 1014 Hz, depending on the nature of the optical emission: either completely or partially coming from the jet.
From our SED fitting, we find that the OIR component is fully consistent with the sum of thermal (optically thick) emission from the accretion disc and non-thermal (synchrotron) emission from the X-ray power law1. The infrared component does not seem compatible with the extrapolation of the radio power law, therefore the radio spectral break must occur at lower frequencies, meaning between 1012 Hz ≤ νbreak ≤ 1013 Hz (we thus exclude the higher break frequency possibility proposed by Tetarenko et al. 2015). In addition, from SED fitting we can set an X-ray spectral break at frequencies 3.1 ≤ νbreak ≤ 3.5 × 10¹⁴ Hz.
For comprehensiveness, we tried another method, constraining the disc temperature parameters, by taking the LX value given by the Swift data points, and using the relationship between LX and  given in Vrtilek et al. (1990). By doing this we derive Ti = 4000 K and Tv = 1600 K, much lower than fitted Ti and Tv values for September 2012, reported in Table 2. We then obtained the irradiation of the K5V star itself, by computing the stellar Teff using LX, following the method described in Ducci et al. (2019). We then fitted the SED using these parameters Ti, Tv, and Teff, the best fit always giving distances of less than 1 kpc, which correspond to a companion star of very late spectral type, typically M5V. Such a combination of M5V companion star at a distance less than 1 kpc would make Swift J1745−26 an exceptionally close-by LMXB. In addition, we point out that, whatever fitting method we use, we always find a power-law cutoff within the optical domain, in agreement with the featureless FORS2 spectra.
Russell et al. (2006) found a correlation between OIR and X-ray emission of black-hole LMXBs. Taking the fluxes obtained in OIR for the beginning of the outburst (MJD 56188 for optical and MJD 56190 for infrared wavelengths), and X-rays (Tomsick et al. 2012; Sbarufatti et al. 2012), we computed the luminosity of Swift J1745−26 at 3.5 kpc in the diagram of black-hole LMXBs (see Fig. 6). OIR and X-ray observations of Swift J1745−26 clearly show that the source always remained in the low/hard state in both epochs, maybe entering a hard/intermediate state towards quiescence when the disc retreats, but always excluding a high-soft state (although we can not exclude a brief intrusion into this state). This confirms our results obtained from SED fitting, with a substantial contribution from radio and X-ray power laws, the OIR SED being due to a reprocessing of X-rays in a cool accretion disc. We thus suggest, in agreement with Curran et al. (2014), that Swift J1745−26 experienced during 2012−2013 a failed transition between hard and soft state, characterized by a radio jet that never completely quenched, and an accretion disc that never reached a high-soft state emission. This failed transition has already been observed in other black-hole transients, such as the microquasars Swift J1753.5−0127 (Cadolle Bel et al. 2007), H 1743−322 (Capitanio et al. 2009; Chaty et al. 2015), MAXI J1836−194 (Ferrigno et al. 2012) and XTE J1550−564 (Curran & Chaty 2013). For instance, in the case of H 1743−322, optical/infrared observations showed that the black hole was both radio quiet and infrared dim in the low/hard state (Chaty et al. 2015).
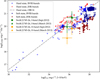 |
Fig. 6. OIR–X-ray luminosity diagram for black-hole LMXB in hard and soft states: data taken from Russell et al. (2006). Swift J1745−26 luminosities, overplotted for I and H bands at 3.5 kpc (green and yellow markers, respectively), are located inside the hard-state correlation, thus showing that the source remained in the low/hard state during its outburst. |
5. Summary
We performed OIR observations of the microquasar Swift J1745−26 during its 2012−2013 outburst with the VLT. Our results can be summarised as follows:
-
During its outburst, the Swift J1745−26 SED from infrared up to X-rays can be adjusted by the sum of both a viscous irradiated multi-colour black body emitted by an accretion disc, and a synchrotron power law at high energy.
-
The OIR emission of Swift J1745−26 arises mainly from a multi-colour black-body accretion disc, with a power law contribution from the X-rays, similarly to H 1743−322 (Chaty et al. 2015). On one hand, since the radio jet does not contribute much to the OIR emission, a spectral break at radio/sub-mm frequencies must exist at frequencies between 1012 Hz ≤ νbreak ≤ 1013 Hz. On the other hand, from SED fitting, we can set an X-ray spectral break at frequencies 3.1 ≤ νbreak ≤ 3.4 × 10¹⁴ Hz.
-
Our SED fitting suggests that the transient source remained in the low/hard state during its outburst, without entering the soft state (so-called failed transition). This is also consistent with the localisation of Swift J1745−26 on the optical-infrared X-ray luminosity diagram.
-
From SED fitting, we also show that the system is compatible with an absorption of AV ∼ 7.69 mag lies within a distance interval of D ∼ [2.6 − 4.8] kpc, with an upper limit of orbital period Porb ≤ 11.3 h, and that the companion is a spectral late-type star in the range K0–M0 V. These results support the classification of Swift J1745−26 as an LMXB.
The results obtained thanks to this work show the importance of getting simultaneous and broad-band multi-wavelength observations of soft X-ray transients, from their outburst to their quiescence.
This would naturally explain why there is no discernable feature on the IR spectrum.
Acknowledgments
The authors are grateful to Dave Russell for the OIR-X-ray data of black hole LMXB kindly sent to build the luminosity diagram in hard and soft state (Russell et al. 2006). We heartfully thank Alexis Coleiro and Federico García for fruitful discussions, Douglas Marshall for a careful rereading of the manuscript, an anonymous referee and the A&A editor Sergio Campana, who gave us valuable comments. This work was supported by the Centre National d’Etudes Spatiales (CNES), based on observations obtained with MINE – Multi-wavelength INTEGRAL NEtwork –, and through the post-doctoral grant awarded to A. López-Oramas. SC is also grateful to the LabEx UnivEarthS for the funding of Interface project “Galactic binaries towards merging”. This research has made use of NASA’s Astrophysics Data System Bibliographic Services and of the SIMBAD database, operated at CDS, Strasbourg, France.
References
- Allen, C. 1973, Astrophysical Quantities, Third Edition (New Jersey: The Athlone Press, Humanities Press Inc.) [Google Scholar]
- Belloni, T., Cadolle Bel, M., Casella, P., et al. 2012, ATel, 4450, 1 [NASA ADS] [Google Scholar]
- Cadolle Bel, M., Ribó, M., Rodriguez, J., et al. 2007, ApJ, 659, 549 [Google Scholar]
- Capitanio, F., Belloni, T., Del Santo, M., & Ubertini, P. 2009, MNRAS, 398, 1194 [NASA ADS] [CrossRef] [Google Scholar]
- Cardelli, J., Clayton, G., & Mathis, J. 1989, ApJ, 345, 245 [NASA ADS] [CrossRef] [Google Scholar]
- Chaty, S. 2013, Adv. Space Res., 52, 2132 [Google Scholar]
- Chaty, S., Haswell, C. A., Malzac, J., et al. 2003, MNRAS, 346, 689 [NASA ADS] [CrossRef] [EDP Sciences] [Google Scholar]
- Chaty, S., Muñoz Arjonilla, A. J., & Dubus, G. 2015, A&A, 577, A101 [Google Scholar]
- Cummings, J. R., Gronwall, C., Grupe, D., et al. 2012a, GRB Coordinates Network, Circular Service, No. 13774, 13774 [Google Scholar]
- Cummings, J. R., Barthelmy, S. D., & Baumgartner, W. H. 2012b, GRB Coordinates Network, Circular Service, No. 13775, 13775 [Google Scholar]
- Cunningham, C. 1976, ApJ, 208, 534 [NASA ADS] [CrossRef] [Google Scholar]
- Curran, P. A., & Chaty, S. 2013, A&A, 557, A45 [NASA ADS] [CrossRef] [EDP Sciences] [Google Scholar]
- Curran, P. A., Coriat, M., Miller-Jones, J. C. A., et al. 2014, MNRAS, 437, 3265 [Google Scholar]
- de Ugarte Postigo, A., Sanchez-Ramirez, R., Munoz-Darias, T., et al. 2012, ATel, 4388, 1 [NASA ADS] [Google Scholar]
- Ducci, L., Mereghetti, S., Hryniewicz, K., Santangelo, A., & Romano, P. 2019, A&A, 624, A9 [NASA ADS] [CrossRef] [EDP Sciences] [Google Scholar]
- Eggleton, P. P. 1983, ApJ, 268, 368 [NASA ADS] [CrossRef] [Google Scholar]
- Faulkner, J., Flannery, B. P., & Warner, B. 1972, ApJ, 175, L79 [Google Scholar]
- Fender, R. 2010, in Lecture Notes in Physics, ed. T. Belloni (Berlin: Springer Verlag), 794, 115 [NASA ADS] [CrossRef] [EDP Sciences] [Google Scholar]
- Ferrigno, C., Bozzo, E., Del Santo, M., & Capitanio, F. 2012, A&A, 537, L7 [Google Scholar]
- Gallo, E., Miller, B. P., & Fender, R. 2012, MNRAS, 423, 590 [NASA ADS] [CrossRef] [Google Scholar]
- Güver, T., & Özel, F. 2009, MNRAS, 400, 2050 [NASA ADS] [CrossRef] [Google Scholar]
- Hynes, R. I., Haswell, C. A., Chaty, S., Shrader, C. R., & Cui, W. 2002, MNRAS, 331, 169 [Google Scholar]
- Hynes, R. I., Britt, C. T., Jonker, P. G., Wijnands, R., & Greiss, S. 2012, ATel, 4417, 1 [NASA ADS] [Google Scholar]
- Kalemci, E., Arabacı, M. Ö., Güver, T., et al. 2014, MNRAS, 445, 1288 [NASA ADS] [CrossRef] [Google Scholar]
- Kreiken, E. A. 1953, ZAp, 32, 125 [NASA ADS] [Google Scholar]
- Muñoz-Darias, T., de Ugarte Postigo, A., Russell, D. M., et al. 2013, MNRAS, 432, 1133 [NASA ADS] [CrossRef] [Google Scholar]
- Russell, D. M., Fender, R. P., Hynes, R. I., et al. 2006, MNRAS, 371, 1334 [NASA ADS] [CrossRef] [Google Scholar]
- Russell, D. M., Lewis, F., Munoz-Darias, T., & Kalemci, E. 2013, ATel, 5084, 1 [NASA ADS] [Google Scholar]
- Sbarufatti, B., Kennea, J. A., Burrows, D. N., et al. 2012, ATel, 4383, 1 [NASA ADS] [Google Scholar]
- Sbarufatti, B., Kennea, J. A., Stroh, M. C., et al. 2013, ATel, 4782, 1 [NASA ADS] [Google Scholar]
- Shahbaz, T., & Kuulkers, E. 1998, MNRAS, 295, L1 [NASA ADS] [Google Scholar]
- Shakura, N. I., & Sunyaev, R. A. 1973, A&A, 24, 337 [NASA ADS] [Google Scholar]
- Tetarenko, A. J., Sivakoff, G. R., Miller-Jones, J. C. A., et al. 2015, ApJ, 805, 30 [Google Scholar]
- Tody, D. 1986, in Instrumentation in Astronomy VI, ed. D. L. Crawford, Proc. SPIE, 627, 733 [NASA ADS] [CrossRef] [Google Scholar]
- Tody, D. 1993, in Astronomical Data Analysis Software and Systems II, eds. R. J. Hanisch, R. J. V. Brissenden, & J. Barnes, ASP Conf. Ser., 52, 173 [Google Scholar]
- Tomsick, J. A., DelSanto, M., & Belloni, T. 2012, ATel, 4393, 1 [NASA ADS] [Google Scholar]
- Vrtilek, S. D., Raymond, J. C., Garcia, M. R., et al. 1990, A&A, 235, 162 [NASA ADS] [Google Scholar]
All Tables
OIR photometry results of Swift J1745−26 during the 2012−2013 outburst, with the date (days, MJD) and apparent magnitudes for the different optical (u, b, v, R and I) and infrared (Js, H, and Ks) filters.
Parameters obtained from fitting the September 2012 and March 2013 SED of Swift J1745−26, including ISAAC, FORS2, and Swift data (“f” means frozen).
All Figures
|
Fig. 1. Optical, infrared, and X-ray light curves of Swift J1745−26 during its 2012−2013 outburst. UBVRI and Js, H, Ks photometry come from the VLT/FORS2 and ISAAC observations, respectively. The high-energy Swift/BAT light curve comes from archival data. |
| In the text | |
|
Fig. 2. VIRCAM 38″ × 38″ field of view, north to the top, east to the left, with a 1″ circle around the position of Swift J1745−26. |
| In the text | |
|
Fig. 3. Spectral energy distribution of VLT/ISAAC (infrared), FORS2 (optical) and Swift/XRT, BAT (soft and hard X-rays) data points of Swift J1745−26 during its 2012−2013 outburst. |
| In the text | |
|
Fig. 4. SED of Swift J1745−26 from OIR to X-rays for September 2012 observations. The SED is built with data points de-reddened with an AV = 7.69 (blue points) and AV = 9.86 mag (red points), respectively. The result of the fit is plotted in black, adding the stellar black body (grey), the multi-colour black-body accretion disc (red), and the X-ray power law (blue). While it is impossible to fit the optical data points de-reddened with an AV of 9.86, a reasonable fit can be obtained with optical and infrared data points de-reddened with an AV of 7.69 mag. |
| In the text | |
|
Fig. 5. Top panel: SED of Swift J1745−26 from OIR to X-rays, for September 2012 (blue points) and March 2013 (green points) observations. The SED is built with data points de-reddened with AV = 7.69. The result of the fit (plotted in black) is the sum of: multi-colour black body accretion disc (in red with Rin = 1600 ISCO for Sept. 2012, and in yellow with Rin = 2900 ISCO for March 2013, respectively), X-ray power law (blue for Sept. 2012 and pink for March 2013 resp.), and potentially stellar contribution (grey upper limit). Bottom panel: broad-band SED of Swift J1745−26 from radio to X-rays for September 2012 observations, including our best fit obtained by adjusting only infrared, optical to X-ray data points (with same colour coding and Rin = 1600 ISCO). For comprehensiveness, we also include radio data points reported in Tetarenko et al. (2015). |
| In the text | |
|
Fig. 6. OIR–X-ray luminosity diagram for black-hole LMXB in hard and soft states: data taken from Russell et al. (2006). Swift J1745−26 luminosities, overplotted for I and H bands at 3.5 kpc (green and yellow markers, respectively), are located inside the hard-state correlation, thus showing that the source remained in the low/hard state during its outburst. |
| In the text | |
Current usage metrics show cumulative count of Article Views (full-text article views including HTML views, PDF and ePub downloads, according to the available data) and Abstracts Views on Vision4Press platform.
Data correspond to usage on the plateform after 2015. The current usage metrics is available 48-96 hours after online publication and is updated daily on week days.
Initial download of the metrics may take a while.