Open Access
Fig. 1.
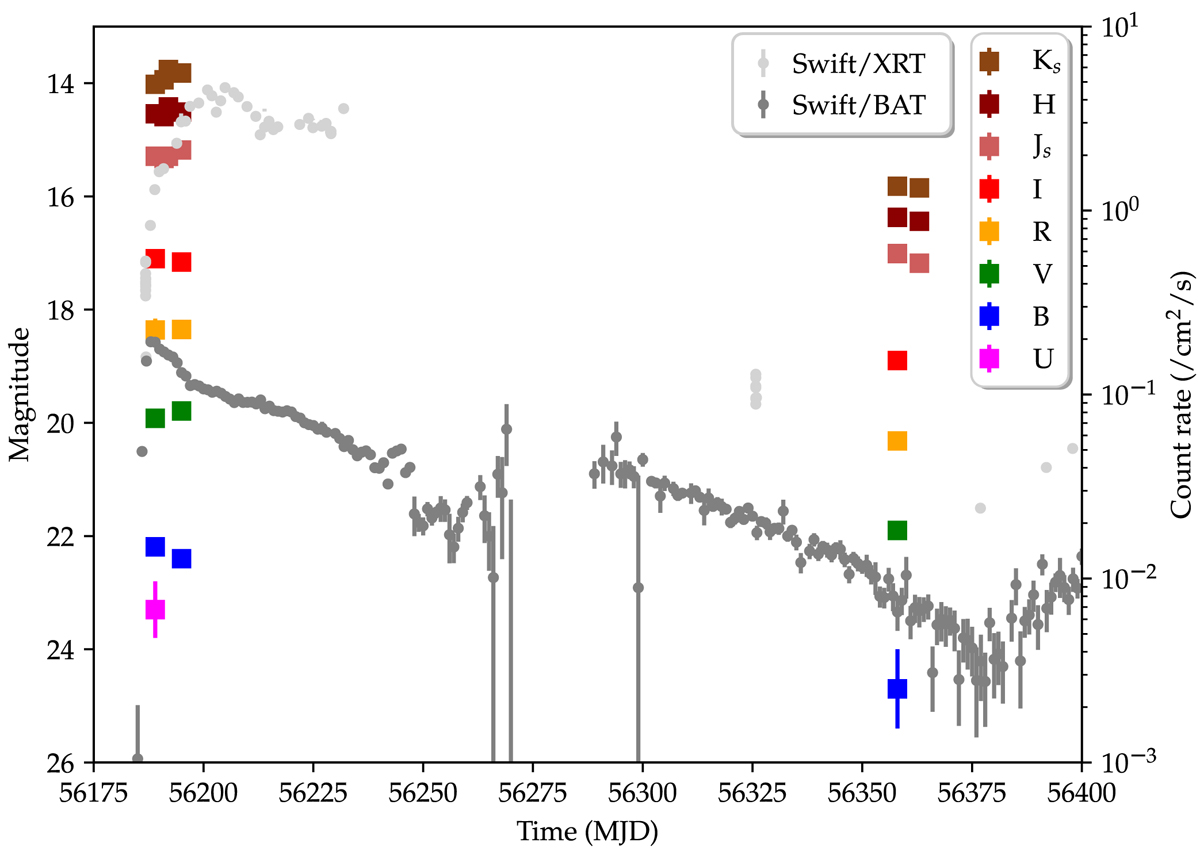
Optical, infrared, and X-ray light curves of Swift J1745−26 during its 2012−2013 outburst. UBVRI and Js, H, Ks photometry come from the VLT/FORS2 and ISAAC observations, respectively. The high-energy Swift/BAT light curve comes from archival data.
Current usage metrics show cumulative count of Article Views (full-text article views including HTML views, PDF and ePub downloads, according to the available data) and Abstracts Views on Vision4Press platform.
Data correspond to usage on the plateform after 2015. The current usage metrics is available 48-96 hours after online publication and is updated daily on week days.
Initial download of the metrics may take a while.