Fig. 6.
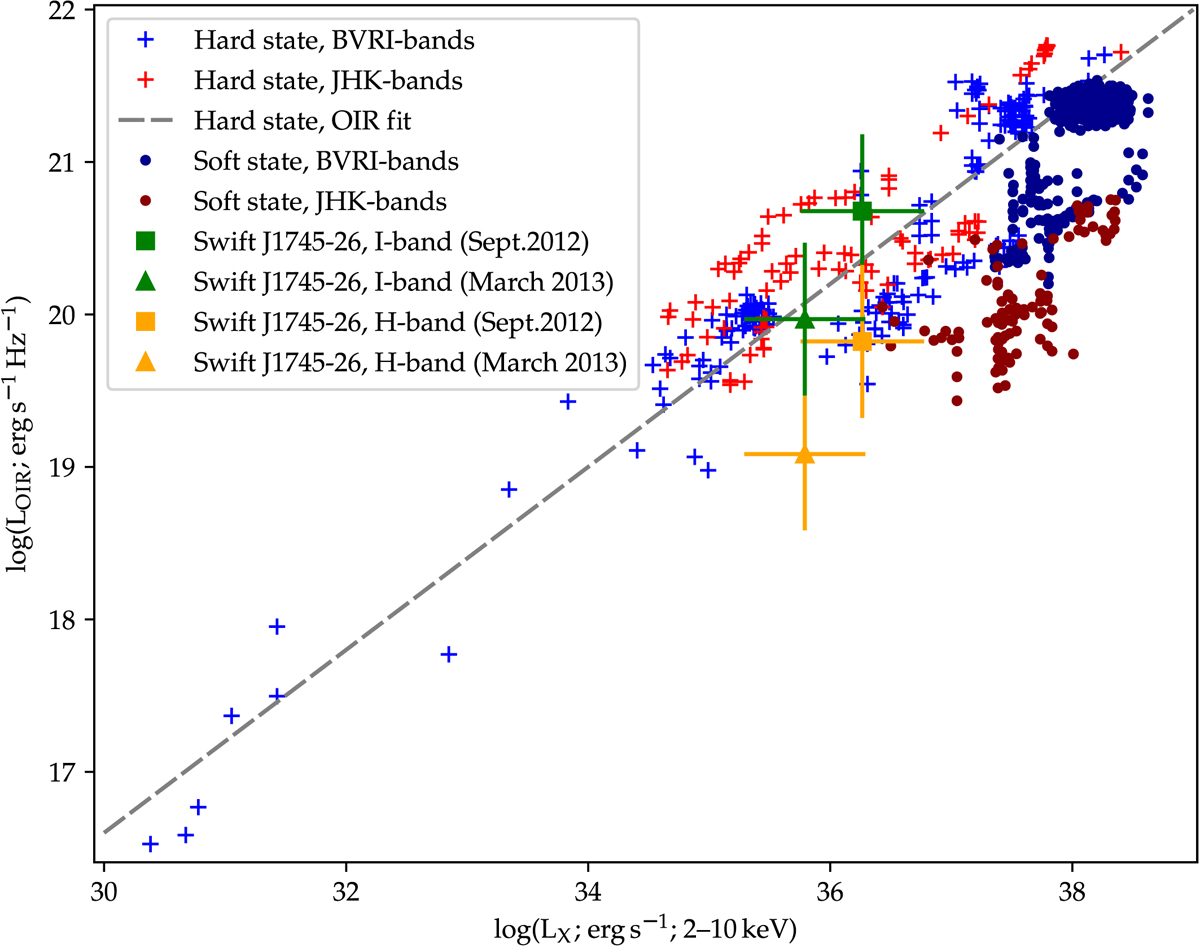
OIR–X-ray luminosity diagram for black-hole LMXB in hard and soft states: data taken from Russell et al. (2006). Swift J1745−26 luminosities, overplotted for I and H bands at 3.5 kpc (green and yellow markers, respectively), are located inside the hard-state correlation, thus showing that the source remained in the low/hard state during its outburst.
Current usage metrics show cumulative count of Article Views (full-text article views including HTML views, PDF and ePub downloads, according to the available data) and Abstracts Views on Vision4Press platform.
Data correspond to usage on the plateform after 2015. The current usage metrics is available 48-96 hours after online publication and is updated daily on week days.
Initial download of the metrics may take a while.