Fig. 4
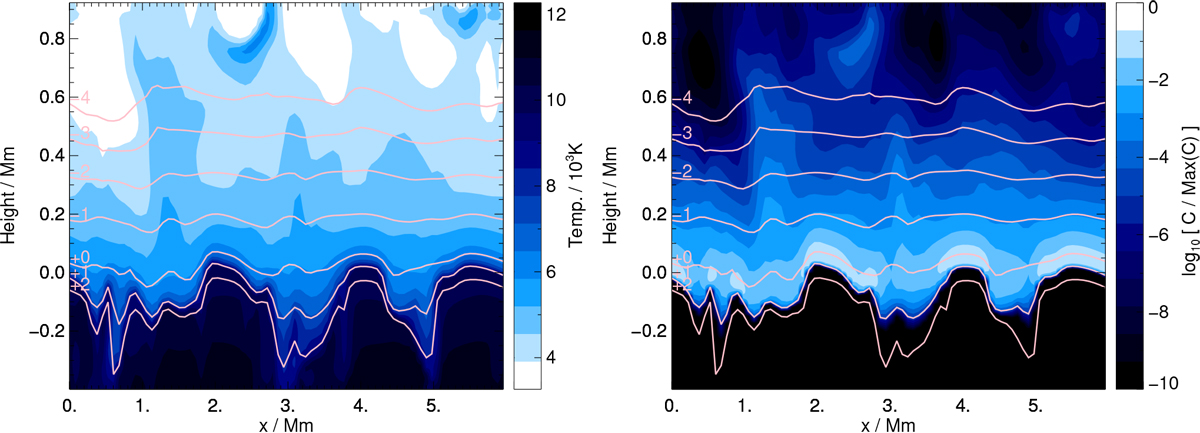
Gas temperature (left) and line forming regions for the N I 868 nm line (right) in a vertical slice of a snapshot of the 3D model solar atmosphere. The latter quantity is based on the line-integrated contribution function to the line depression in the disk-centre intensity (Eq. (15) of Amarsi 2015). Contours of constant log τR are overplotted.
Current usage metrics show cumulative count of Article Views (full-text article views including HTML views, PDF and ePub downloads, according to the available data) and Abstracts Views on Vision4Press platform.
Data correspond to usage on the plateform after 2015. The current usage metrics is available 48-96 hours after online publication and is updated daily on week days.
Initial download of the metrics may take a while.