Free Access
Fig. 3
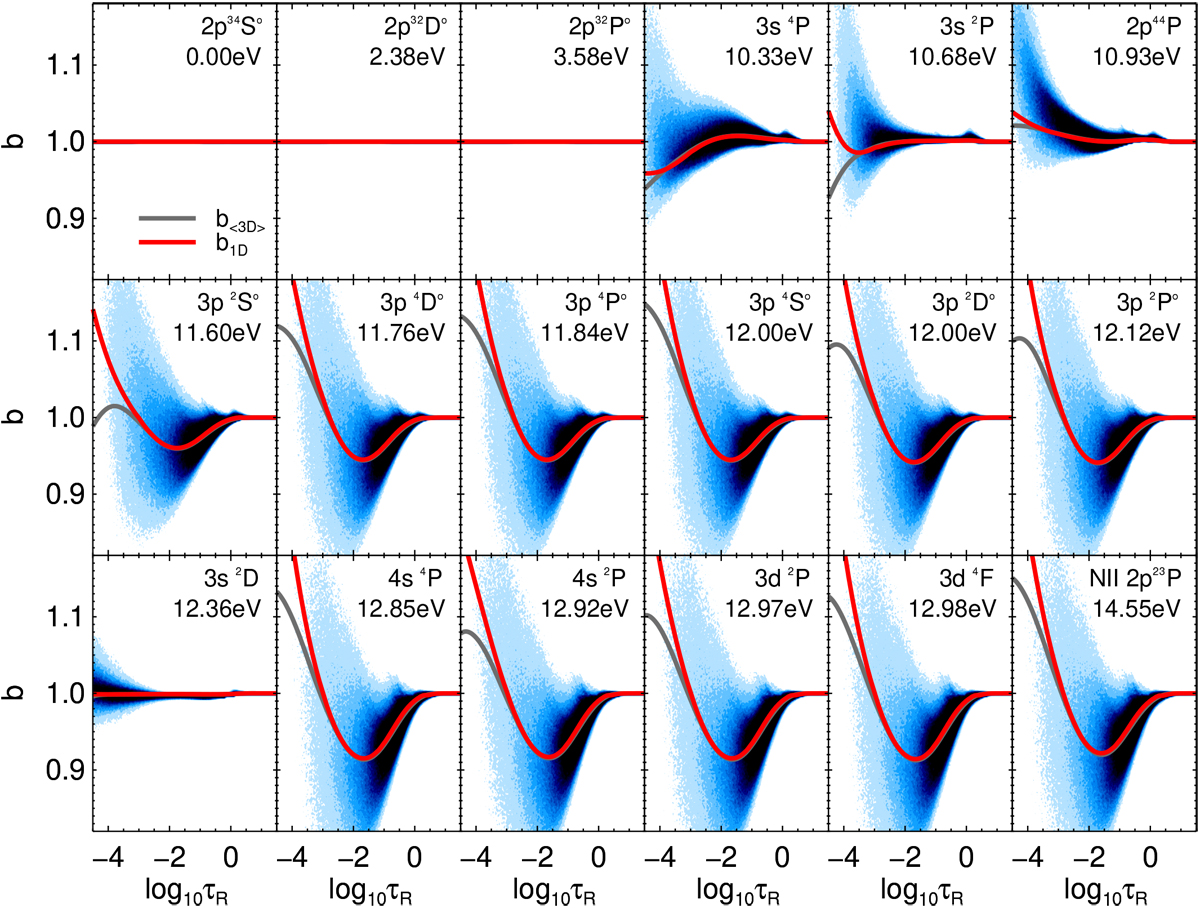
Departure coefficients for the lowest 17 LS terms of N I in order of increasing energy (from left to right, top to bottom), as well as the ground level of N I (final panel). The contours show the distributions in the 3D model solar atmosphere. The departure coefficients calculated in the ⟨3D⟩ and 1D models are overplotted.
Current usage metrics show cumulative count of Article Views (full-text article views including HTML views, PDF and ePub downloads, according to the available data) and Abstracts Views on Vision4Press platform.
Data correspond to usage on the plateform after 2015. The current usage metrics is available 48-96 hours after online publication and is updated daily on week days.
Initial download of the metrics may take a while.