Fig. 2
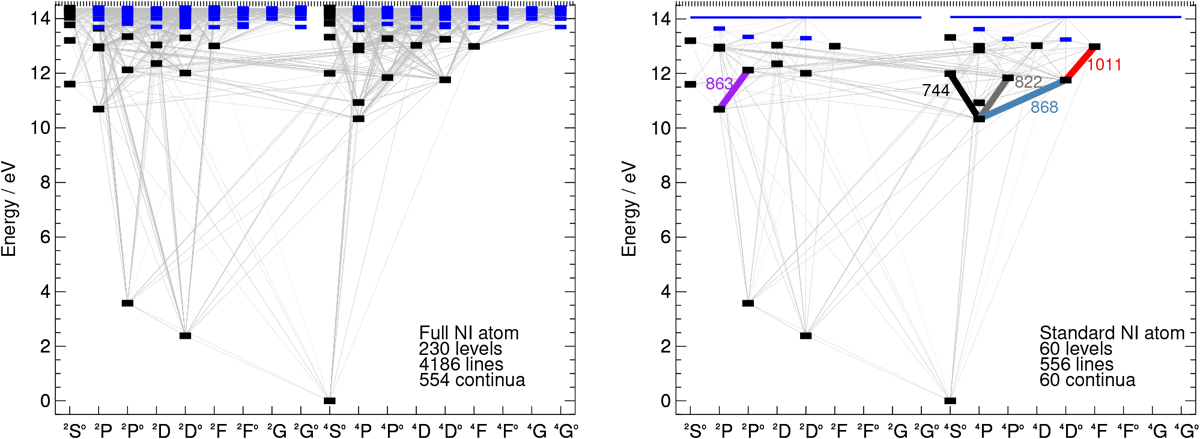
Grotrian diagrams for N I in the comprehensive starting non-LTE model atom (left), and in the resulting non-LTE model atom after reducing its complexity (right). Energy levels are indicated as short black horizontal lines; those levels for which fine structure is not resolved are indicated as short blue horizontal lines, and super levels are shown as long blue horizontal lines. All bound–bound radiative transitions considered in the non-LTE iterations are shown in grey. The five abundance indicators are labelled and marked specially in the right panel.
Current usage metrics show cumulative count of Article Views (full-text article views including HTML views, PDF and ePub downloads, according to the available data) and Abstracts Views on Vision4Press platform.
Data correspond to usage on the plateform after 2015. The current usage metrics is available 48-96 hours after online publication and is updated daily on week days.
Initial download of the metrics may take a while.