| Issue |
A&A
Volume 636, April 2020
|
|
|---|---|---|
| Article Number | A34 | |
| Number of page(s) | 3 | |
| Section | Astrophysical processes | |
| DOI | https://doi.org/10.1051/0004-6361/202037772 | |
| Published online | 10 April 2020 | |
Strong surface outflows on accretion discs
1
Department of Physics and Astronomy, University of Leicester, Leicester LE1 7RH, UK
e-mail: cjn@leicester.ac.uk
2
Institute of Astronomy, Madingley Road, Cambridge CB3 0HA, UK
Received:
19
February
2020
Accepted:
3
March
2020
In order to provide an explanation for the unexpected radial brightness distribution of the steady accretion discs seen in nova-like variables, we have recently proposed that the accretion energy is redistributed outwards by means of strong, magnetically driven surface flows. In this paper we note that the “powerful, rotating disc winds” observed in the soft states of black hole X-ray binaries, and also in the disc around a magnetised neutron star in Her X–1, have the properties of the outflows we recently postulated to exist in the nova-like variable accretion discs around white dwarfs. The relevant properties are that the flows are not winds, but are instead bound flows (travelling at less than the escape velocity) and that the mass fluxes in the flows are a substantial fraction of the accretion rate in the disc.
Key words: accretion, accretion disks / magnetic fields / magnetohydrodynamics (MHD) / novae, cataclysmic variables / black hole physics / X-rays: binaries
© ESO 2020
1. Introduction
In a recent paper, Nixon & Pringle (2019) drew attention to the observational evidence that in the (quasi-)steady accretion discs in nova-like variables the radial distribution of emission of radiation does not agree with the expected radial distribution of dissipation of accretion energy. The observations indicate that there is a severe energy deficit in the inner disc regions. This implies that the accretion energy is not radiated away from where it is released. Nixon & Pringle (2019) speculated that the MHD turbulence, which is thought to power the accretion in such fully ionised, high-viscosity discs, gives rise to magnetically driven, corona-like structures (which, to avoid confusion, they named magnetically controlled zones, or MCZs). They suggested that these MCZs give rise to the outward transfer of mass, energy, and angular momentum in the form of a low-density, high-velocity flow in the low-density regions of the disc above and below the disc plane. Nixon & Pringle (2019) proposed a simple toy model for the flows in the MCZs, and showed that approximate agreement with the observations could be achieved if the mass outflow in the MCZs was in the range of μ ≈ 10%−30% of the accretion rate, and if, on average, the effect of the MCZ was to throw material outwards a distance of around k ≈ 1.5 − 3 times the launching radius.
In order to estimate the typical radial velocities involved in such a process we note that if material in a disc at radius R around a central star of mass M and circular velocity  , where the escape velocity
is impulsively given, in addition, a radial velocity vR = fvϕ (with f < 1, i.e. a bound flow), then assuming conservation of angular momentum, the material reaches a radius kR, where k = 1/(1 − f). If f ≥ 1 then the material is unbound, and the outward flow becomes a wind. Thus, the values of f required by the toy model of Nixon & Pringle are in the range f ≈ 0.3 − 0.7.
In Sect. 2 we discuss the properties of the “accretion disc wind” in the X-ray binary system Her X–1/HZ Her, reported by Kosec et al. (2020). The geometry of this system relative to the observer is well established, and the line of sight passes close to the disc surface. We find that the flow velocities are mostly below the escape velocity, and conclude that this is not a wind in the conventional sense. However, the flow properties, in terms of velocities and mass flux, agree with those postulated in Nixon & Pringle (2019). In Sect. 3 we discuss the properties of the equatorial “disc winds” seen in the soft states of black hole binaries. Here the geometry is not so exactly established, but circumstantial evidence suggests that the systems are all at high inclination (Ponti et al. 2012). Again we find that these flows are not unbound and so do not correspond to winds, but the flow properties do align with those proposed by Nixon & Pringle (2019), both in terms of velocities and in terms of mass fluxes. We present discussion in Sect. 4.
2. Hercules X–1
Kosec et al. (2020) present evidence for outward flow of material close to the disc surface in the X-ray binary Hercules X–1.
Hercules X–1 was one of the brightest and most intriguing X-ray sources discovered by the UHURU satellite (Tananbaum et al. 1972). The X-ray emission displayed regular pulses with a period of 1.24 s, regular eclipses with a period of 1.7 days, and a regular cycle of appearances and disappearances with a period of around 35 days. The suggested optical identification with the variable star HZ Her by Liller (1972) was confirmed by the discovery that this star showed a light curve with the same 1.7 day period (Bahcall & Bahcall 1972).
The short period X-ray pulsations were quickly identified as being due to accretion onto a rotating, strongly magnetised neutron star (Davidson & Ostriker 1972, see also Pringle & Rees 1972). The X-ray eclipses are caused by occultations of the X-ray flux by a binary companion, and the main 1.7 day variation of the optical light curve is identified as primarily caused by heating of one side of the star by the X-ray flux from its compact companion (Bahcall & Bahcall 1972; Joss et al. 1973; Pringle 1973).
Thus, Her X–1 is the X-ray counterpart of the variable star system HZ Her. The binary system consists of a 2.3 M⊙ primary star of spectral type F to A depending on whether the X-ray illuminated side is being observed or not. The secondary (less massive) component is a neutron star with assumed mass 1.4 M⊙. There is Roche lobe mass transfer from the primary to the secondary, forming an accretion disc. The disc is truncated by the magnetosphere of the neutron star at a radius of about R ≈ 2 × 108 cm. The outer edge of the disc is at R ≈ 2 × 1011 cm, and the binary separation is around a ≈ 6 × 1011 cm.
Identification of the cause of the 35 day X-ray light curve proved more problematic. Gerend & Boynton (1976) proposed a phenomenological model for this behaviour, which also explained subtle variations in the optical light curve over the 35 day cycle. They proposed that the neutron star was encircled by a large, tilted accretion disc, which precessed with the period of 35 days. The explanation as to why the accretion disc might be tilted and precess was later provided in terms of radiation-driven disc warping (Iping & Petterson 1990; Pringle 1996; Wijers & Pringle 1999). This model is also capable of providing an explanation for detailed behaviour of the X-ray flux through the 35 day period (see e.g. Scott et al. 2000; Leahy 2002).
In this system, Kosec et al. (2020) report evidence of blue-shifted absorption features, seen primarily in the high-ionisation lines of N VII, O VIII, N X, and Fe XXV/XXVI. For these features they identify (given in their Table 3) a radial velocity (vR), relative to the neutron star, as well as an ionisation parameter, ξ, for the absorbing plasma. From the ionisation parameter they are able to estimate a maximum radial distance, Rmax, that the absorbing material can have from the neutron star (given in their Table 5). In line with previous work (see Sect. 3) Kosec et al. (2020) interpret this outward moving material as evidence for a disc wind.
As noted by Kosec et al. (2020), the absorption features seen in the Her X–1 X-ray data lie along the line of sight between the observer and the neutron star. Moreover, because the 35 day variation in the Her X–1/HZ Her system is caused by a warped and tilted disc moving in and out of the line of sight to the neutron star, it is evident that when the X-ray source is visible those lines of sight must lie close to the surface of the disc. Thus, in the Nixon & Pringle model of a steady disc, those lines of sight would be passing through the postulated MCZ.
We now look at the wind hypothesis in more detail. One basic property of a wind is that the velocity of the wind should exceed the escape velocity. For typical winds, the wind velocity exceeds the escape velocity by a factor of a few. At a given radius, R, the escape velocity is
Thus, for each observation we have the radial velocity, vR, of the plasma, and we also have a lower limit to the escape velocity, vesc(Rmax), from the upper limit Rmax to the radius at which the absorption feature is formed. We show these values in Table 1. There we have omitted the observations with ID 0673510801 (for which no entry is given in Kosec et al. 2020, Table 5) and 0783770701 (for which the error bars given in Kosec et al. 2020, Tables 3 and 5, are too substantial).
Relevant data adapted from Kosec et al. (2020).
In Fig. 1 we plot the observed radial velocity vR against the (lower limit to the) escape velocity from the estimated radius at which the line is formed. We note that almost all of the radial velocities are lower than the escape velocity. This is made clearer in Fig. 2 where we plot the parameter f, defined in Sect. 1, again versus the estimated escape velocity at which the line is formed. Taking into account the large formal error bars which Kosec et al. (2020) attach to their data as well as other possible uncertainties, it is evident that most of the outflowing material seen in Her X–1 is well below the escape velocity.
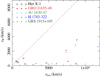 |
Fig. 1. Measured outflow radial velocity, vR, against the lower limit to the escape velocity calculated from the estimated upper limit of the launching radius (see Tables 3 and 5 in Kosec et al. 2020 for the data on Her X–1, and Tables 11 and 12 in Miller et al. 2015 for the data on GRO J1655−40, 4U 1630−47, H 1743−322, and GRS 1915+105). The error bars (not plotted) are substantial. The red dashed line describes vR = vesc. In all but one case the measured radial velocities are below (the lower limit to) the escape velocity. |
Thus, the blue-shifted emission lines observed by Kosec et al. (2020) seem to indicate an outflow of material within a few tens of degrees of the surface of the disc whose velocities are (mostly) below the escape velocity. We see that the estimated values of f from these observations are in the right ballpark for the MCZ-driven outflows postulated by Nixon & Pringle (2019). We also note that the estimated outflow mass loss rates (Table 5 of Kosec et al. 2020) are sizeable fractions of the estimated accretion rates, also in line with the requirements of the toy model for MCZ flows proposed by Nixon & Pringle (2019).
3. Disc winds in other systems
Outflows of the kind reported by Kosec et al. (2020) have also been reported in other systems, mainly in stellar mass black hole binaries (Miller et al. 2006a,b; King et al. 2012; Ponti et al. 2012; Trueba et al. 2019). In all of these systems the disc surface is thought to be close to the line of sight (Miller et al. 2006a,b; Ponti et al. 2012). A detailed analysis of four of these systems (4U 1630−47, GRO J1655−40, H 1732−322, and GRS 1915+105) is given by Miller et al. (2015). In these systems the analysis and modelling of the spectra requires the absorption lines to be modelled as being formed in two or three launching zones, depending on the source. Miller et al. (2015) also deduce approximate radii for the formation of these lines using both photo-ionisation models (as in Kosec et al. 2020) and also using the width of accompanying emission components, assumed to correspond to the Keplerian velocity at the line-formation radius. Both these methods are in approximate agreement, although the uncertainties (error bars) are large.
In Fig. 1, we plot the radial velocities vR measured for the absorption lines in these systems (given as vabs in Table 11 of Miller et al. 2015) against the escape velocity of the estimated formation radii (deduced from the values rphot in Table 12 of Miller et al. 2015). In Fig. 2 we plot the corresponding values of the parameter f. In these objects it is evident that all of the observed gas is flowing outwards at well under the escape velocity. From Table 12 of Miller et al. (2015) it is also evident that the mass fluxes involved in the outflows are all substantial fractions of the estimated accretion rates.
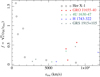 |
Fig. 2. Value |
4. Conclusions
We have investigated the properties of the so-called disc winds reported to be associated with the steady accretion discs in X-ray binaries, containing both black holes and neutron stars. The evidence for the wind or outflow is found in the form of absorption lines seen along the line of sight to the central source of X-rays – being the disc centre in the black hole systems and the neutron star in Her X–1. There seems to be good evidence that these lines of sight pass close (typically around 10 ° −20°) to the disc surface (Ponti et al. 2012; Kosec et al. 2020). Analysis of the formation region of these lines is able to give an indication of the radii at which the lines are formed, as well as an estimate of the local gas densities. From these radii it is possible to estimate the escape velocities from the line formation regions. In Figs. 1 and 2 we have shown that the outflow velocities are typically significantly less than the escape velocities where the lines are formed. We conclude that these outflows are not unbound and so do not represent winds, in the conventional sense of the word. Rather they indicate the presence of outflows of material along the surface of the disc. Estimates of the energies involved in the outflows indicate that they involve a significant fraction of the accretion energy (Miller et al. 2015; Trueba et al. 2019; Kosec et al. 2020).
We have argued that the properties of these disc surface outflows match the properties of the magnetically controlled outflows postulated by Nixon & Pringle (2019) as an explanation of the anomalous properties of steady accretion discs seen in the nova-like variables, in terms of spatial structure, velocity structure, and energy flux. Nixon & Pringle (2019) postulated that such flows are driven by magnetic stresses originating in the disc, in agreement with Miller et al. (2015) who argue that in the absence of other possibilities the outflows that they observe must be magnetically driven.
If these conclusions are correct, we note that our understanding of how (fully-ionised, steady) accretion discs operate needs to be substantially revised, in particular with regard to the modelling of the magneto-rotational instability and resultant MHD turbulence, which is thought to drive such discs. It has already been noted (King et al. 2007; Martin et al. 2019) that numerical simulations of such discs are unable to match the high values of the disc viscosity required by the observations (viscosity parameter α ∼ 0.3). We further note that although global numerical simulations of magnetised discs do appear to show surface flows, driven by magnetic stresses, the properties of such flows do not appear commensurate with what is observed. The general picture, resulting from several numerical investigations of strongly magnetised discs with substantial net vertical magnetic flux, is that winds (vR > vesc) can be produced at vertical heights above the disc of z ∼ R with mass fluxes of order of 1%−10% of the accretion flow, and that surface flows involving several 10 s of percent of the accretion flow are present, but always flow inwards (Sdowski et al. 2016; Zhu & Stone 2018; Jiang et al. 2019; Zhu et al. 2019; Mishra et al. 2020). So far it does not appear that these simulations have found the observed surface outflows with mass fluxes that are a significant fraction of the accretion flow and outward radial velocities that are of the order of the orbital velocity, but significantly below the escape velocity.
Acknowledgments
We thank Mitch Begelman, Peter Kosec, Jean-Pierre Lasota and Jon Miller for sending comments on the manuscript, and the referee for a positive report. CJN is supported by the Science and Technology Facilities Council (Grant number ST/M005917/1).
References
- Bahcall, J. N., & Bahcall, N. A. 1972, ApJ, 178, L1 [NASA ADS] [CrossRef] [Google Scholar]
- Davidson, K., & Ostriker, J. P. 1972, Nat. Phys. Sci., 236, 46 [NASA ADS] [CrossRef] [Google Scholar]
- Gerend, D., & Boynton, P. E. 1976, ApJ, 209, 562 [NASA ADS] [CrossRef] [Google Scholar]
- Iping, R. C., & Petterson, J. A. 1990, A&A, 239, 221 [NASA ADS] [Google Scholar]
- Jiang, Y.-F., Blaes, O., Stone, J. M., & Davis, S. W. 2019, ApJ, 885, 144 [NASA ADS] [CrossRef] [Google Scholar]
- Joss, P. C., Avni, Y., & Bahcall, J. N. 1973, ApJ, 186, 767 [NASA ADS] [CrossRef] [Google Scholar]
- King, A. R., Pringle, J. E., & Livio, M. 2007, MNRAS, 376, 1740 [NASA ADS] [CrossRef] [Google Scholar]
- King, A. L., Miller, J. M., Raymond, J., et al. 2012, ApJ, 746, L20 [NASA ADS] [CrossRef] [Google Scholar]
- Kosec, P., Fabian, A. C., Pinto, C., et al. 2020, MNRAS, 491, 3730 [NASA ADS] [Google Scholar]
- Leahy, D. A. 2002, ASP Conf. Ser., 264, 46 [NASA ADS] [Google Scholar]
- Liller, W. 1972, IAU Circ., 2415, 1 [NASA ADS] [Google Scholar]
- Martin, R. G., Nixon, C. J., Pringle, J. E., & Livio, M. 2019, New Astron., 70, 7 [NASA ADS] [CrossRef] [Google Scholar]
- Miller, J. M., Raymond, J., Fabian, A., et al. 2006a, Nature, 441, 953 [NASA ADS] [CrossRef] [PubMed] [Google Scholar]
- Miller, J. M., Raymond, J., Homan, J., et al. 2006b, ApJ, 646, 394 [NASA ADS] [CrossRef] [Google Scholar]
- Miller, J. M., Fabian, A. C., Kaastra, J., et al. 2015, ApJ, 814, 87 [NASA ADS] [CrossRef] [Google Scholar]
- Mishra, B., Begelman, M. C., Armitage, P. J., & Simon, J. B. 2020, MNRAS, 492, 1855 [NASA ADS] [CrossRef] [Google Scholar]
- Nixon, C. J., & Pringle, J. E. 2019, A&A, 628, A121 [NASA ADS] [CrossRef] [EDP Sciences] [Google Scholar]
- Ponti, G., Fender, R. P., Begelman, M. C., et al. 2012, MNRAS, 422, L11 [NASA ADS] [CrossRef] [Google Scholar]
- Pringle, J. E. 1973, Nat. Phys. Sci., 243, 90 [NASA ADS] [CrossRef] [Google Scholar]
- Pringle, J. E. 1996, MNRAS, 281, 357 [NASA ADS] [Google Scholar]
- Pringle, J. E., & Rees, M. J. 1972, A&A, 21, 1 [NASA ADS] [Google Scholar]
- Sdowski, A., Tejeda, E., Gafton, E., Rosswog, S., & Abarca, D. 2016, MNRAS, 458, 4250 [NASA ADS] [CrossRef] [Google Scholar]
- Scott, D. M., Leahy, D. A., & Wilson, R. B. 2000, ApJ, 539, 392 [NASA ADS] [CrossRef] [Google Scholar]
- Tananbaum, H., Gursky, H., Kellogg, E. M., et al. 1972, ApJ, 174, L143 [NASA ADS] [CrossRef] [Google Scholar]
- Trueba, N., Miller, J. M., Kaastra, J., et al. 2019, ApJ, 886, 104 [NASA ADS] [CrossRef] [Google Scholar]
- Wijers, R. A. M. J., & Pringle, J. E. 1999, MNRAS, 308, 207 [NASA ADS] [CrossRef] [Google Scholar]
- Zhu, Z., & Stone, J. M. 2018, ApJ, 857, 34 [NASA ADS] [CrossRef] [Google Scholar]
- Zhu, Z., Jiang, Y. F., & Stone, J. M. 2019, MNRAS, submitted [arXiv:1912.01632] [Google Scholar]
All Tables
All Figures
|
Fig. 1. Measured outflow radial velocity, vR, against the lower limit to the escape velocity calculated from the estimated upper limit of the launching radius (see Tables 3 and 5 in Kosec et al. 2020 for the data on Her X–1, and Tables 11 and 12 in Miller et al. 2015 for the data on GRO J1655−40, 4U 1630−47, H 1743−322, and GRS 1915+105). The error bars (not plotted) are substantial. The red dashed line describes vR = vesc. In all but one case the measured radial velocities are below (the lower limit to) the escape velocity. |
| In the text | |
|
Fig. 2. Value |
| In the text | |
Current usage metrics show cumulative count of Article Views (full-text article views including HTML views, PDF and ePub downloads, according to the available data) and Abstracts Views on Vision4Press platform.
Data correspond to usage on the plateform after 2015. The current usage metrics is available 48-96 hours after online publication and is updated daily on week days.
Initial download of the metrics may take a while.