Fig. 8
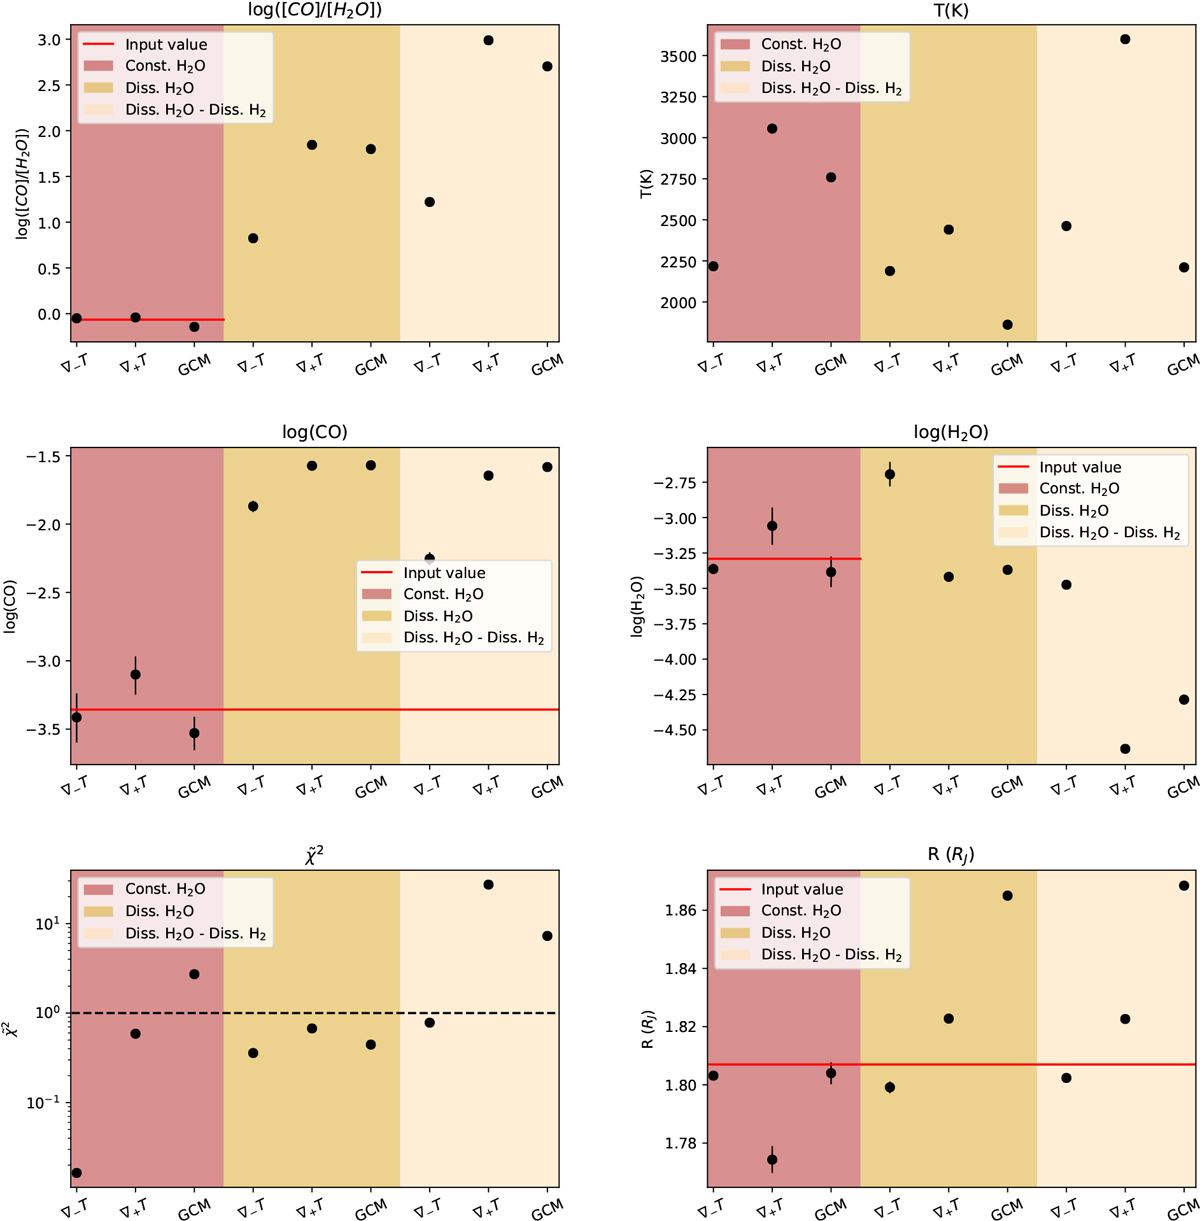
Summary of all the retrieval results for the ∇−T
, ∇+ T
, and GCM simulations considering every case. We show the ratio [CO]∕[H2O] (top left), temperature (top right), log abundances of CO (middle left) and H2O (middle right), ![]() (bottom left), and planetary radius (bottom right). These retrievals have been calculated with a shot noise assuming a floor noise of 30ppms through the whole spectral domain. The red line represents the input value from our simulations and the black dotted line shows where
(bottom left), and planetary radius (bottom right). These retrievals have been calculated with a shot noise assuming a floor noise of 30ppms through the whole spectral domain. The red line represents the input value from our simulations and the black dotted line shows where
![]() = 1.
= 1.
Current usage metrics show cumulative count of Article Views (full-text article views including HTML views, PDF and ePub downloads, according to the available data) and Abstracts Views on Vision4Press platform.
Data correspond to usage on the plateform after 2015. The current usage metrics is available 48-96 hours after online publication and is updated daily on week days.
Initial download of the metrics may take a while.