Fig. 6
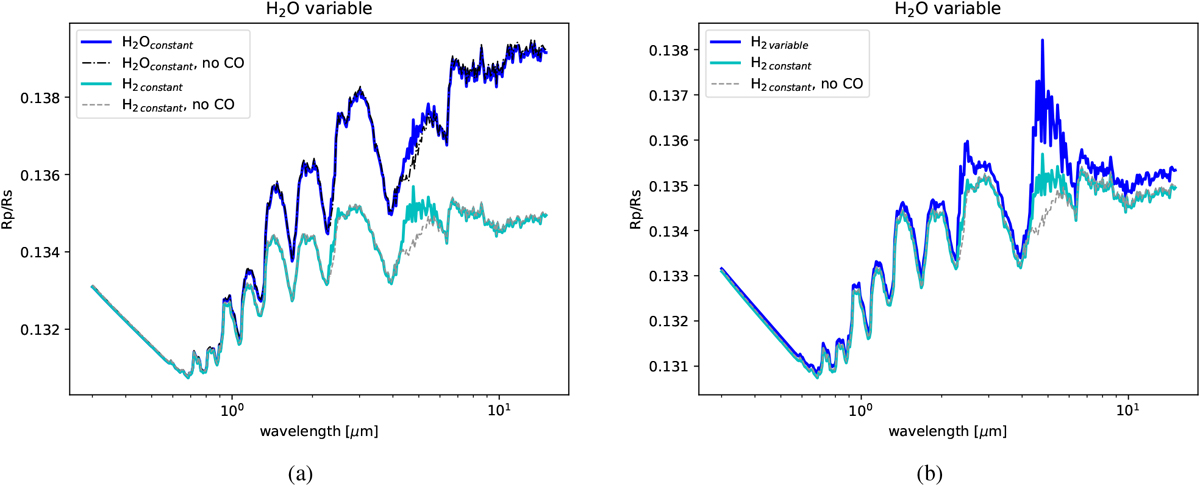
Left: transmission spectra of Wasp-121b at a resolution of R = 100 for GCM simulations assuming a constant H2 abundance in the whole atmosphere. When water dissociation is taken into account (light blue line), the water features become shallower compared to when no water dissociation is assumed (blue line). Right: transmission spectra of Wasp-121b at a resolution of R = 100 for GCM simulations taking into account H2O dissociation in the atmosphere. When H2 dissociation is considered (blue line), the CO features appear more clearly compared to when we neglect H2 dissociation (light blue line). The black and gray curve correspond to the transmission spectra for an atmosphere without CO for the water constant and the dissociated case, respectively, to highlight the features of CO in the other curves.
Current usage metrics show cumulative count of Article Views (full-text article views including HTML views, PDF and ePub downloads, according to the available data) and Abstracts Views on Vision4Press platform.
Data correspond to usage on the plateform after 2015. The current usage metrics is available 48-96 hours after online publication and is updated daily on week days.
Initial download of the metrics may take a while.