Fig. 1
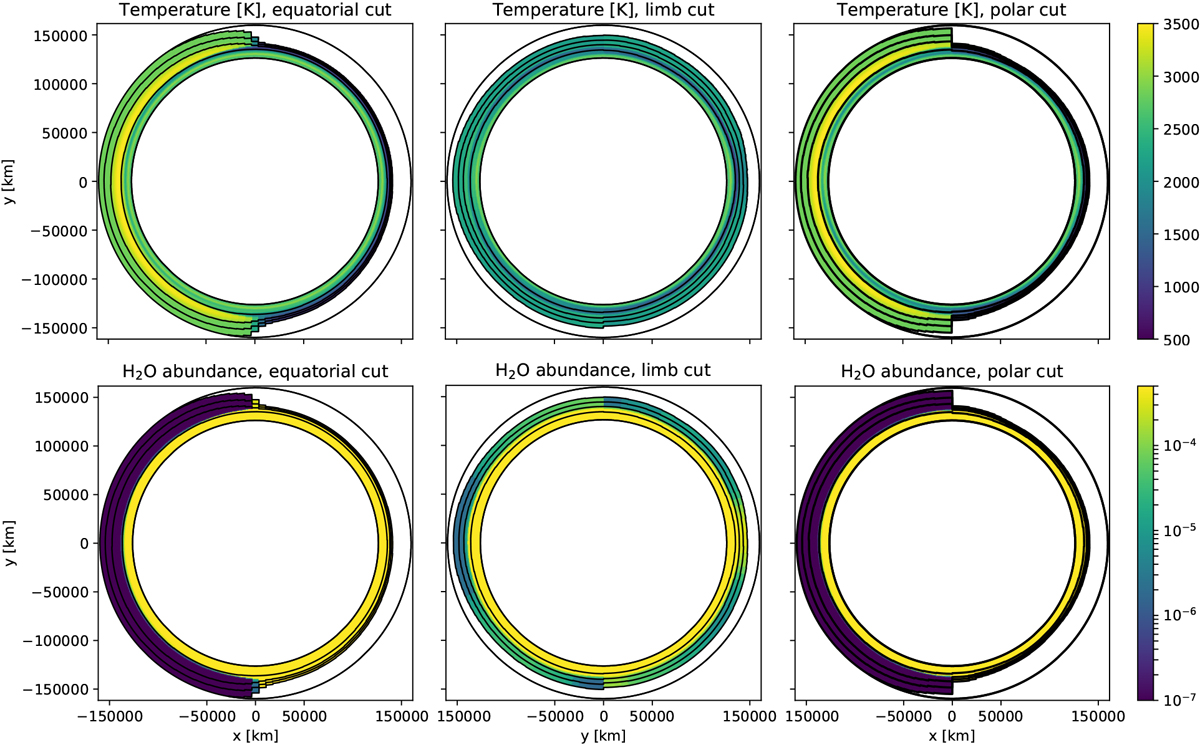
GCM simulation of Wasp-121b (Parmentier et al. 2018) without H2 dissociation. Temperature (top) and water abundance (bottom) for the equatorial cut (left), limb cut (middle), and pole cut (right). From the center outward, the five solid lines are respectively the 1, 434 × 107, 103, 1, 10−2, and 10−4 Pa pressure levels. The color-coding for the water abundance maps goes from 5 × 10⁻⁴ to 10−7. The radius of the planet and the atmosphere are shown to scale.
Current usage metrics show cumulative count of Article Views (full-text article views including HTML views, PDF and ePub downloads, according to the available data) and Abstracts Views on Vision4Press platform.
Data correspond to usage on the plateform after 2015. The current usage metrics is available 48-96 hours after online publication and is updated daily on week days.
Initial download of the metrics may take a while.