Fig. 2.
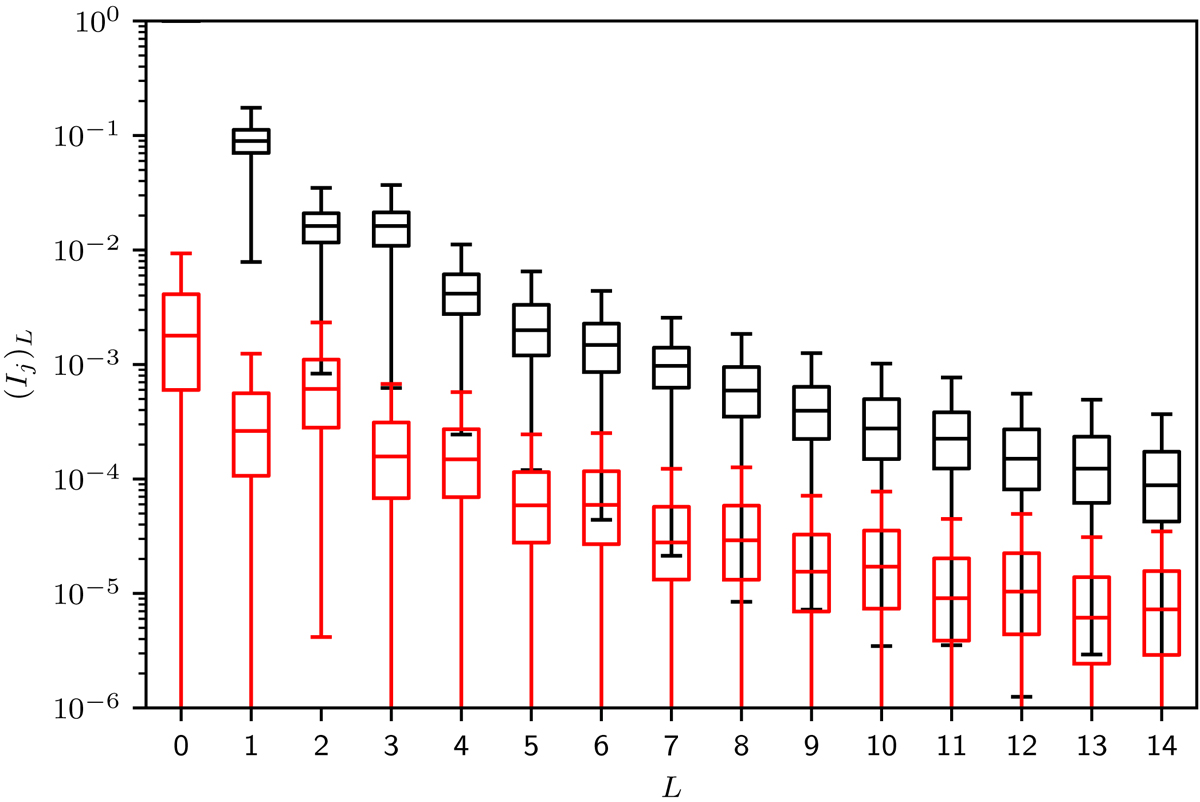
Statistical distribution of the amplitudes (Ij)ℓ defined in Eq. (16) of the spherical harmonic components of Stokes I (black) and Stokes Q (red) at the unit optical depth for disc-centre line of sight of the Ca I 4227 Å line in a 3D snapshot model of the solar atmosphere (Carlsson et al. 2016) calculated using a very fine GT quadrature (20 × 20 points per octant).
Current usage metrics show cumulative count of Article Views (full-text article views including HTML views, PDF and ePub downloads, according to the available data) and Abstracts Views on Vision4Press platform.
Data correspond to usage on the plateform after 2015. The current usage metrics is available 48-96 hours after online publication and is updated daily on week days.
Initial download of the metrics may take a while.