Open Access
Fig. 6.
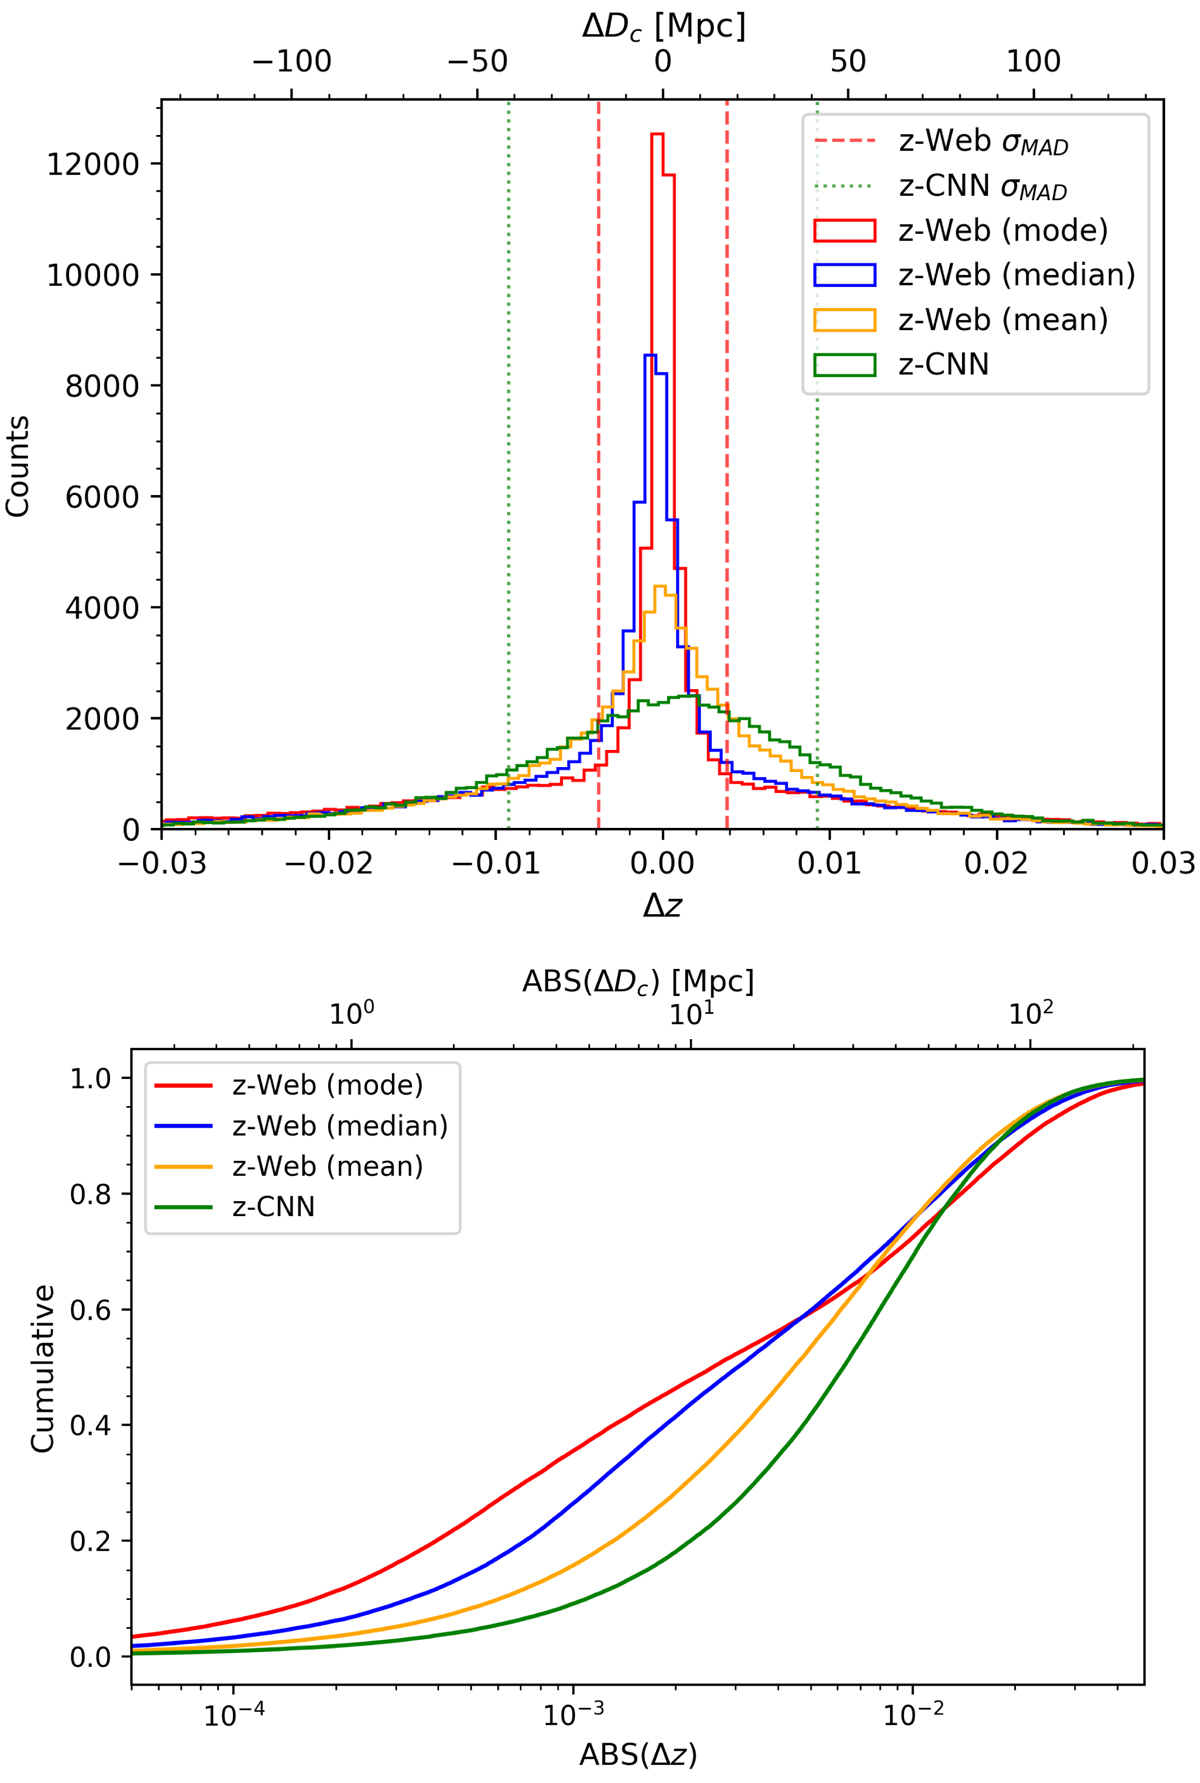
Differential (top) and cumulative (bottom) histograms of the residuals for the zweb (mode: red, median: blue, mean: orange) and zCNN (green). The dashed and dotted vertical lines indicate the respective σMAD. The distance uncertainties in comoving Mpc are shown on the top axis (assuming ⟨z⟩∼0.1).
Current usage metrics show cumulative count of Article Views (full-text article views including HTML views, PDF and ePub downloads, according to the available data) and Abstracts Views on Vision4Press platform.
Data correspond to usage on the plateform after 2015. The current usage metrics is available 48-96 hours after online publication and is updated daily on week days.
Initial download of the metrics may take a while.