Fig. 4.
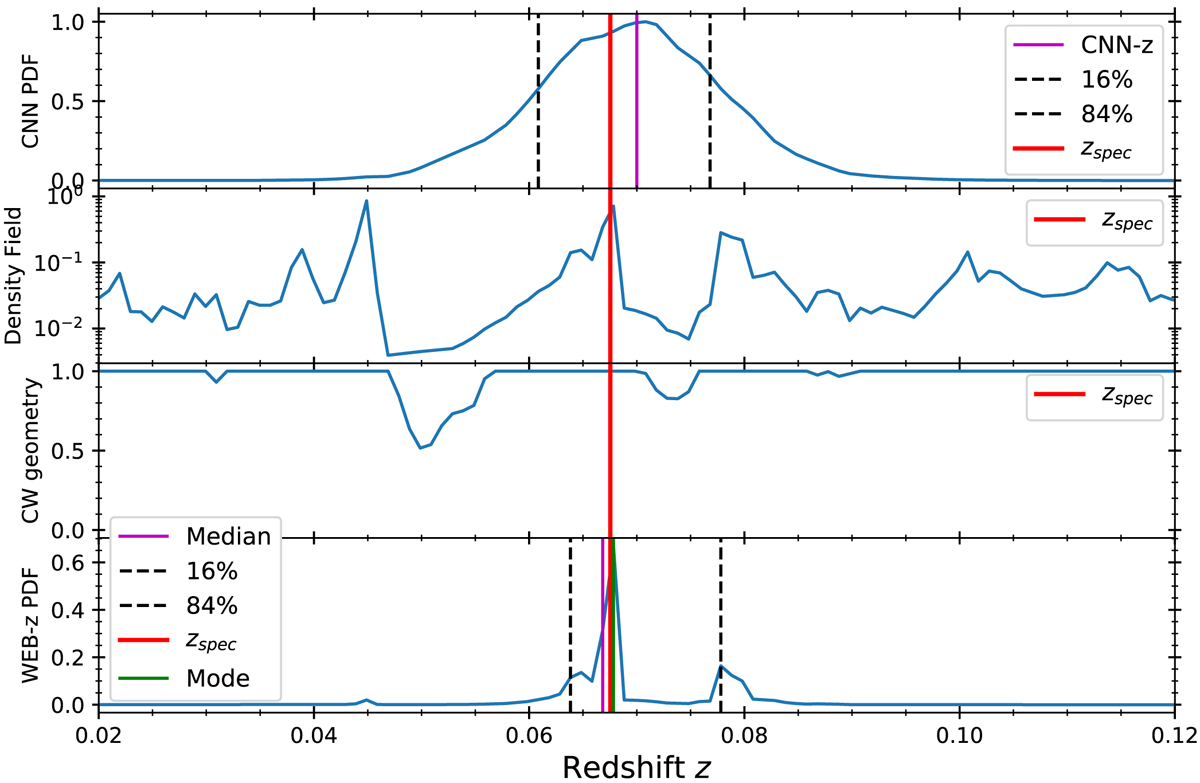
Illustration of the PW-z technique. From top to bottom: (i) initial CNN photometric redshift PDF, (ii) CW density field, (iii) probability taking into account the closest distance of any geometric structure of the CW (Eq. (2)), (iv) final PW-z PDF. The red line indicates the zspec, the magenta line the zCNN (top panel) and the median of the PW-z PDF (bottom panel), the green line indicates the mode of the PW-z PDF, and the dashed lines the 68% confidence interval.
Current usage metrics show cumulative count of Article Views (full-text article views including HTML views, PDF and ePub downloads, according to the available data) and Abstracts Views on Vision4Press platform.
Data correspond to usage on the plateform after 2015. The current usage metrics is available 48-96 hours after online publication and is updated daily on week days.
Initial download of the metrics may take a while.