Open Access
Fig. 3.
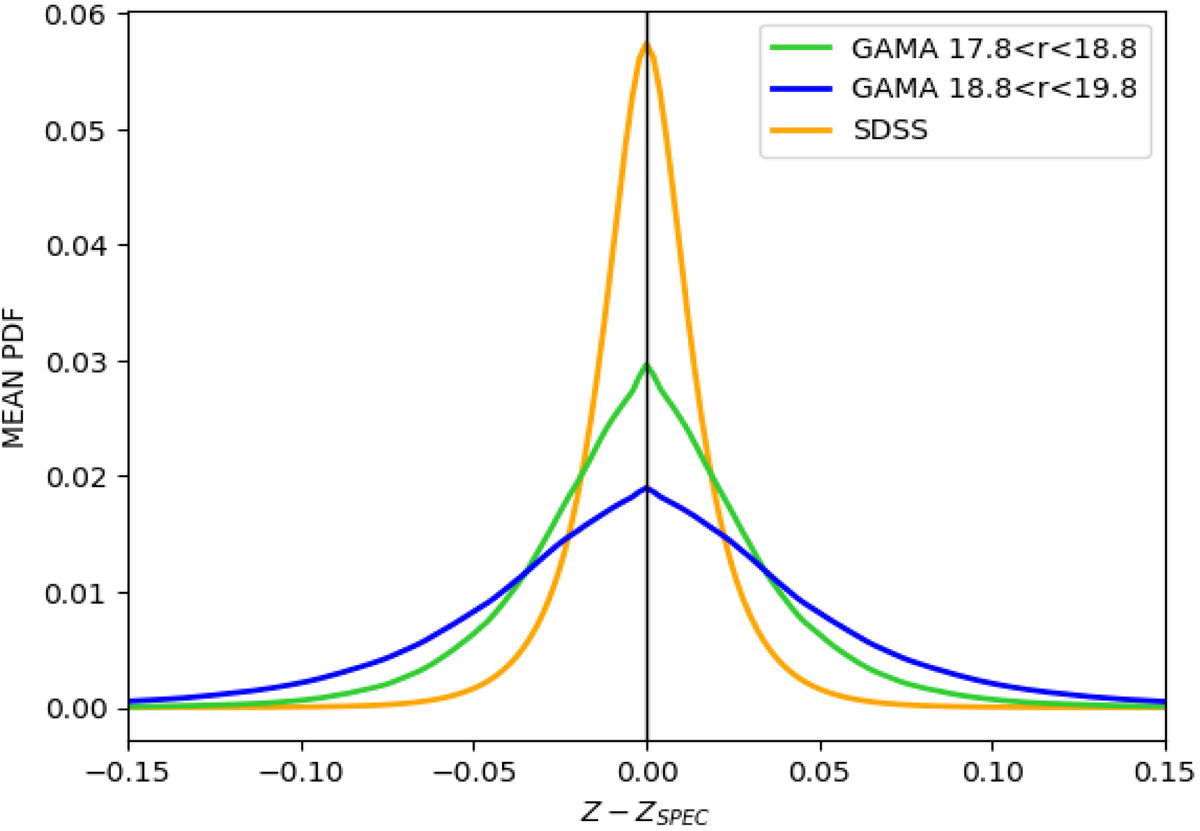
Mean PDFs, recentered on the individual spectroscopic redshifts, for the SDSS and GAMA surveys. We define three subsamples according to their magnitude range: r < 17.8 (orange line), 17.8 < r < 18.8 (green line), and 18.8 < r < 19.8 (blue line).
Current usage metrics show cumulative count of Article Views (full-text article views including HTML views, PDF and ePub downloads, according to the available data) and Abstracts Views on Vision4Press platform.
Data correspond to usage on the plateform after 2015. The current usage metrics is available 48-96 hours after online publication and is updated daily on week days.
Initial download of the metrics may take a while.