Fig. 15.
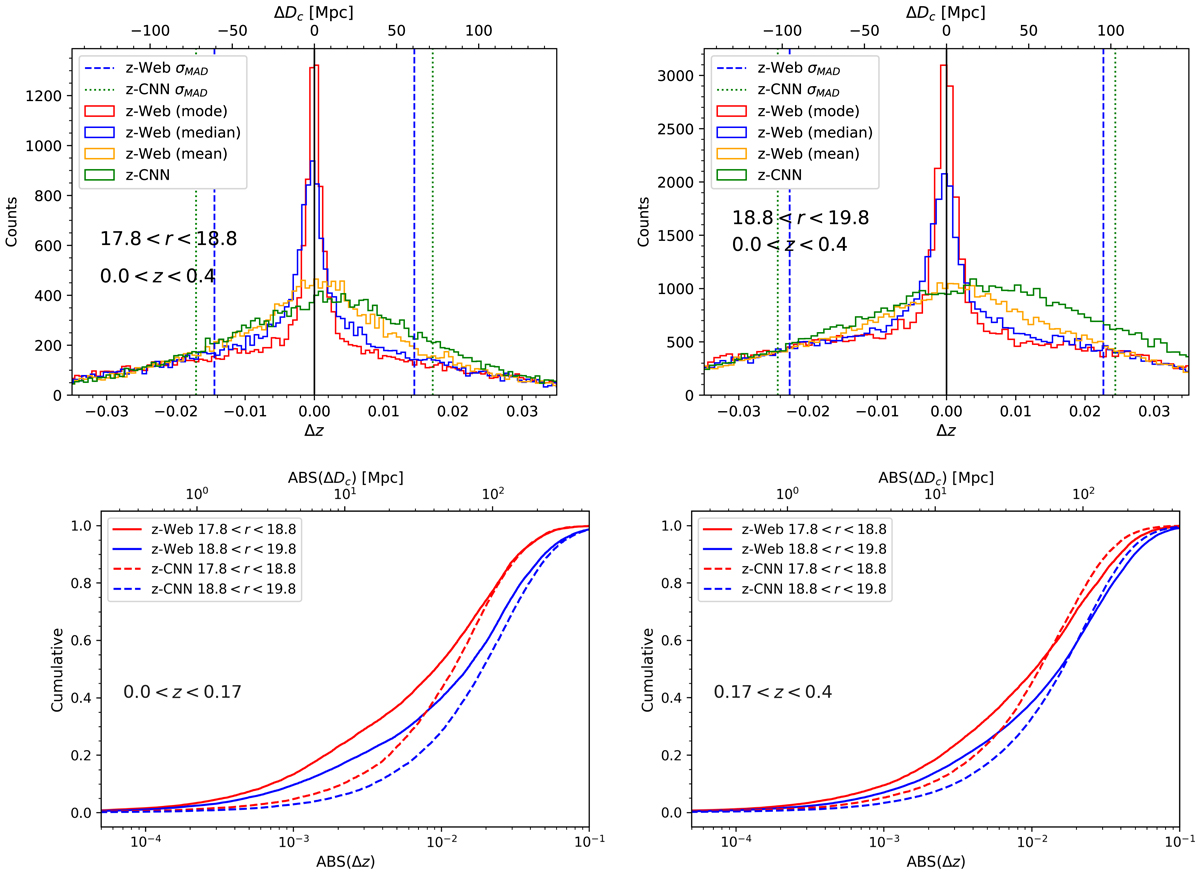
Redshift residuals of the zCNN and zweb for the GAMA survey. Top: differential histograms with the full sample for the zCNN (green) and the zweb (with the mode, median, and mean of the PDF) at 17.8 ≤ r ≤ 18.8 (left), and 18.8 ≤ r ≤ 19.8 (right). Bottom left: cumulative histograms for the zCNN (dashed line) and zweb (median only, solid line) at low redshift (z ≤ 0.17) and split into two magnitude bins (red: 17.8 ≤ r ≤ 18.8; blue: 18.8 ≤ r ≤ 19.8). Bottom right: same as left, but at high redshift (0.17 ≤ z ≤ 0.4).
Current usage metrics show cumulative count of Article Views (full-text article views including HTML views, PDF and ePub downloads, according to the available data) and Abstracts Views on Vision4Press platform.
Data correspond to usage on the plateform after 2015. The current usage metrics is available 48-96 hours after online publication and is updated daily on week days.
Initial download of the metrics may take a while.