Fig. 5.
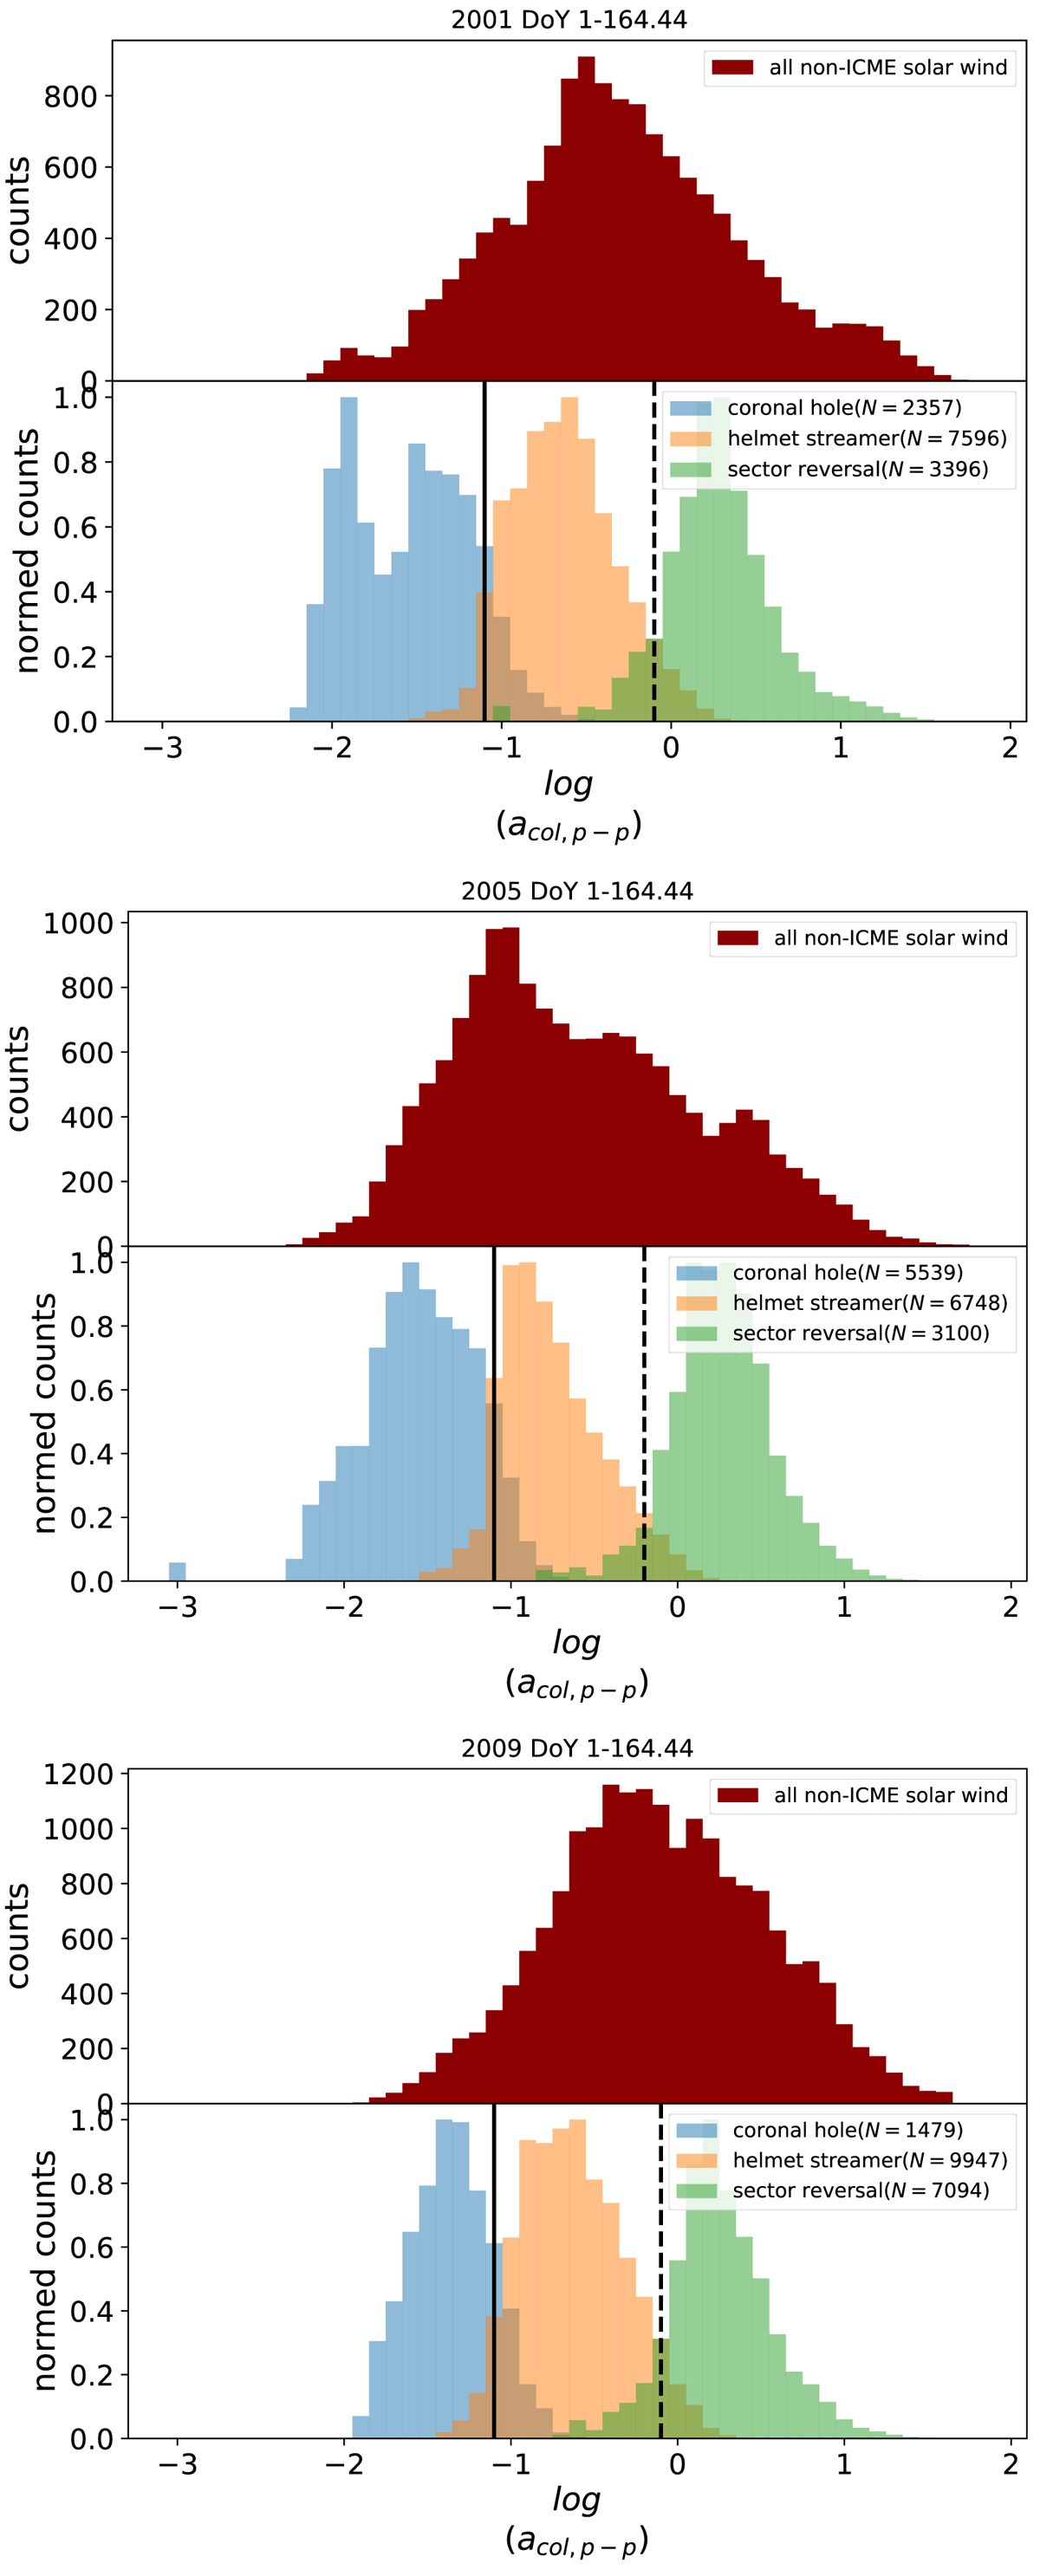
Summed 1-dimensional histograms of the proton-proton collisional age for different selected time frames. Top: DoY 1−164.44 in 2001. Middle: 1−164.44 in 2005. Bottom: DoY 1−164.44 in 2009. In each subplot, the upper panel gives the non-normalized histograms of all observations for the three solar wind types (coronal hole wind in dark blue, helmet-streamer plasma in orange, and sector-reversal plasma in dark green, following the Xu & Borovsky 2015 scheme), the lower panel shows the three histograms normalized according to solar wind type. The black solid vertical lines indicate the respective minimum ![]() between coronal hole wind and helmet-streamer plasma, and the black dashed line indicates the minimum
between coronal hole wind and helmet-streamer plasma, and the black dashed line indicates the minimum ![]() between helmet-streamer and sector-reversal plasma. (To make all three histograms visible at the same time, the alpha channel is set to 0.5). The sample size is indicated in the legend in each subplot.
between helmet-streamer and sector-reversal plasma. (To make all three histograms visible at the same time, the alpha channel is set to 0.5). The sample size is indicated in the legend in each subplot.
Current usage metrics show cumulative count of Article Views (full-text article views including HTML views, PDF and ePub downloads, according to the available data) and Abstracts Views on Vision4Press platform.
Data correspond to usage on the plateform after 2015. The current usage metrics is available 48-96 hours after online publication and is updated daily on week days.
Initial download of the metrics may take a while.