Fig. 8
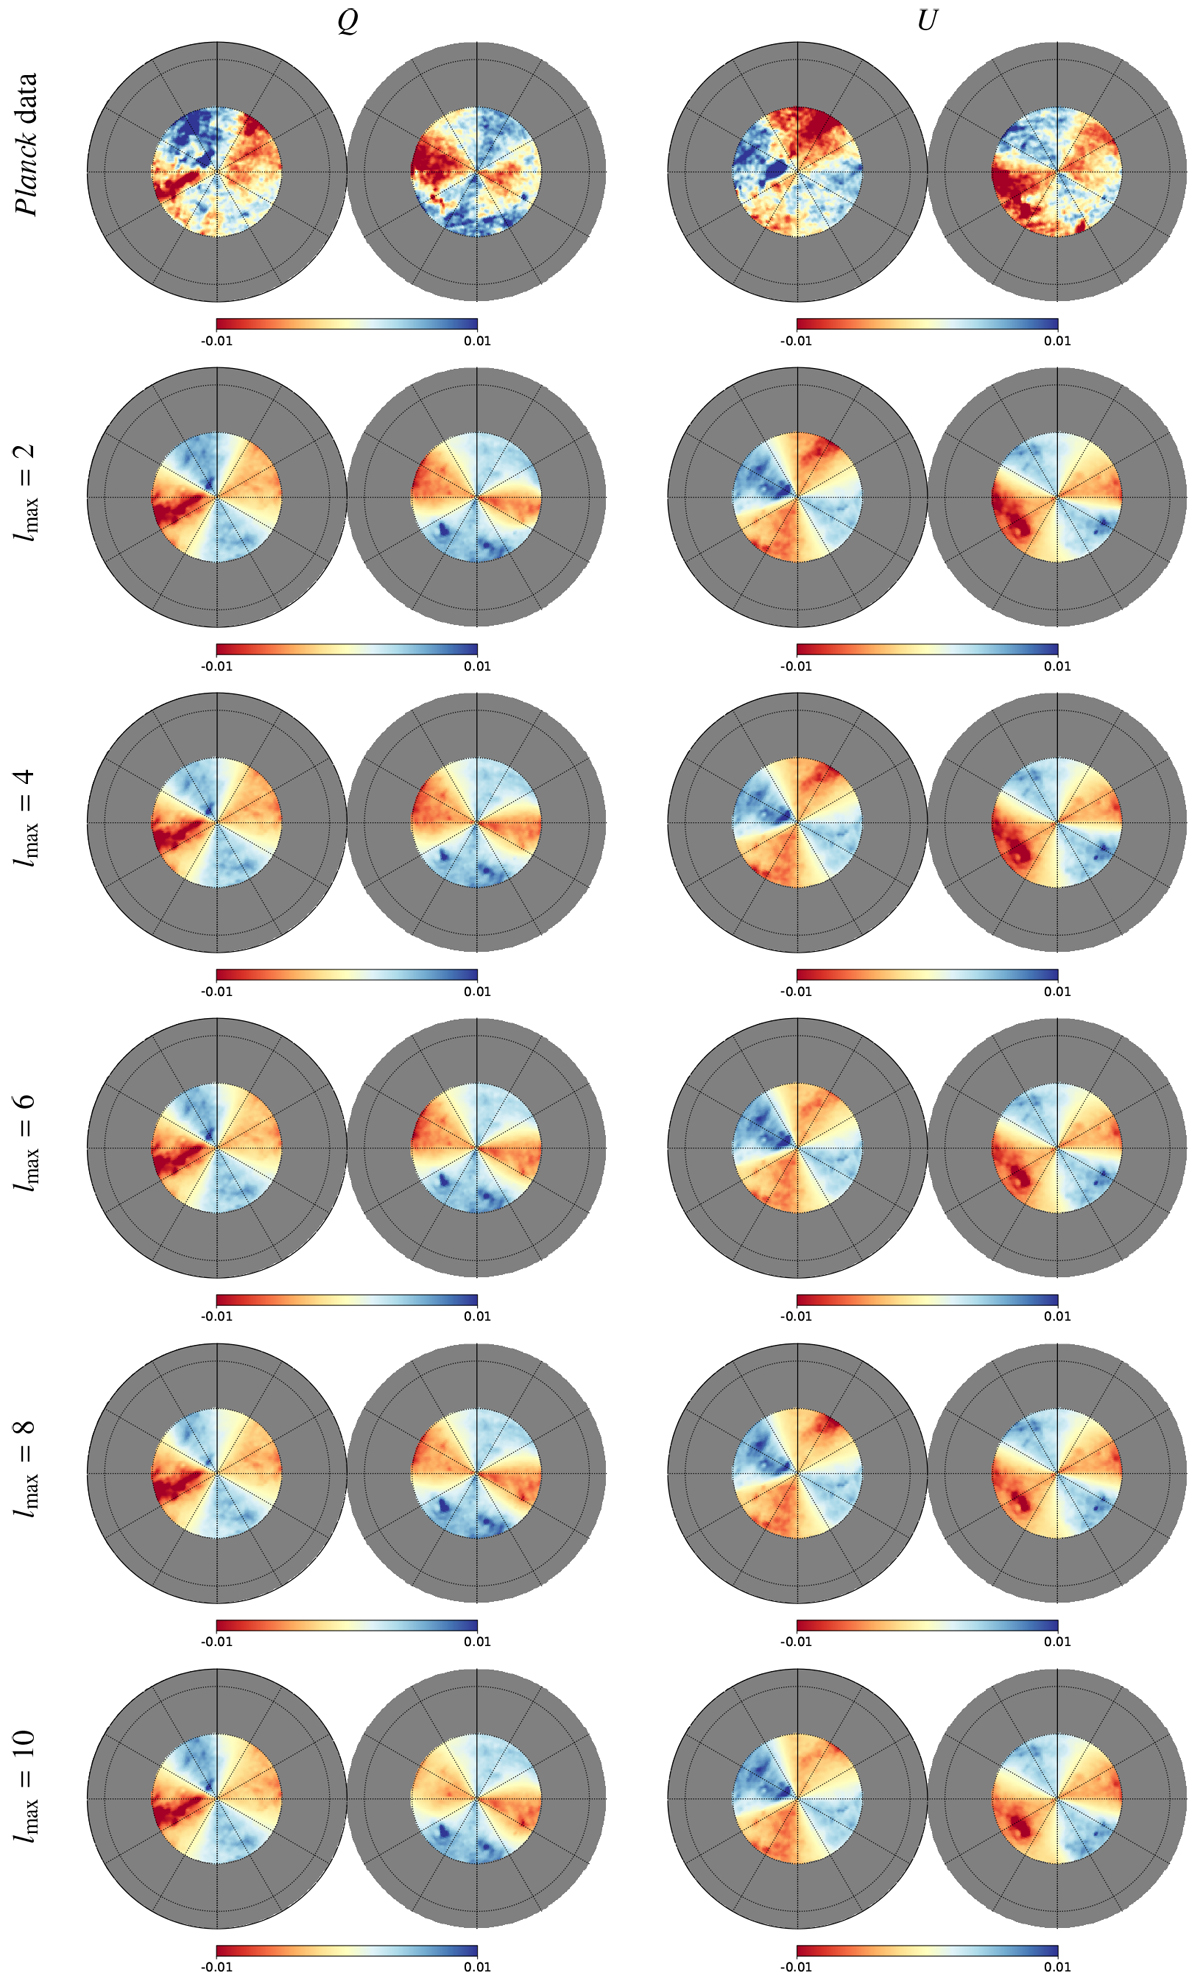
Orthographic views of the Q (left) and U (right) maps at 353 GHz. From top to bottom: Planck PR3 data and best-fit maps corresponding to the modeled shapes of the LB shell obtained from the L19 3D extinction map, with lmax = 2, 4, 6, 8, and 10. The background structures underlying the maps come from the dust column density taken from the data. Units are MJy sr−1. In orthographic views, the North and South Galactic Poles lie at the center of the left and right circles, respectively, the vertical solid radius shows longitude 0°, and the left and right panels touch at l = 90°. The gray area corresponds to the region |b| < 60°, which is notconsidered in the fitting procedure.
Current usage metrics show cumulative count of Article Views (full-text article views including HTML views, PDF and ePub downloads, according to the available data) and Abstracts Views on Vision4Press platform.
Data correspond to usage on the plateform after 2015. The current usage metrics is available 48-96 hours after online publication and is updated daily on week days.
Initial download of the metrics may take a while.