Fig. 7
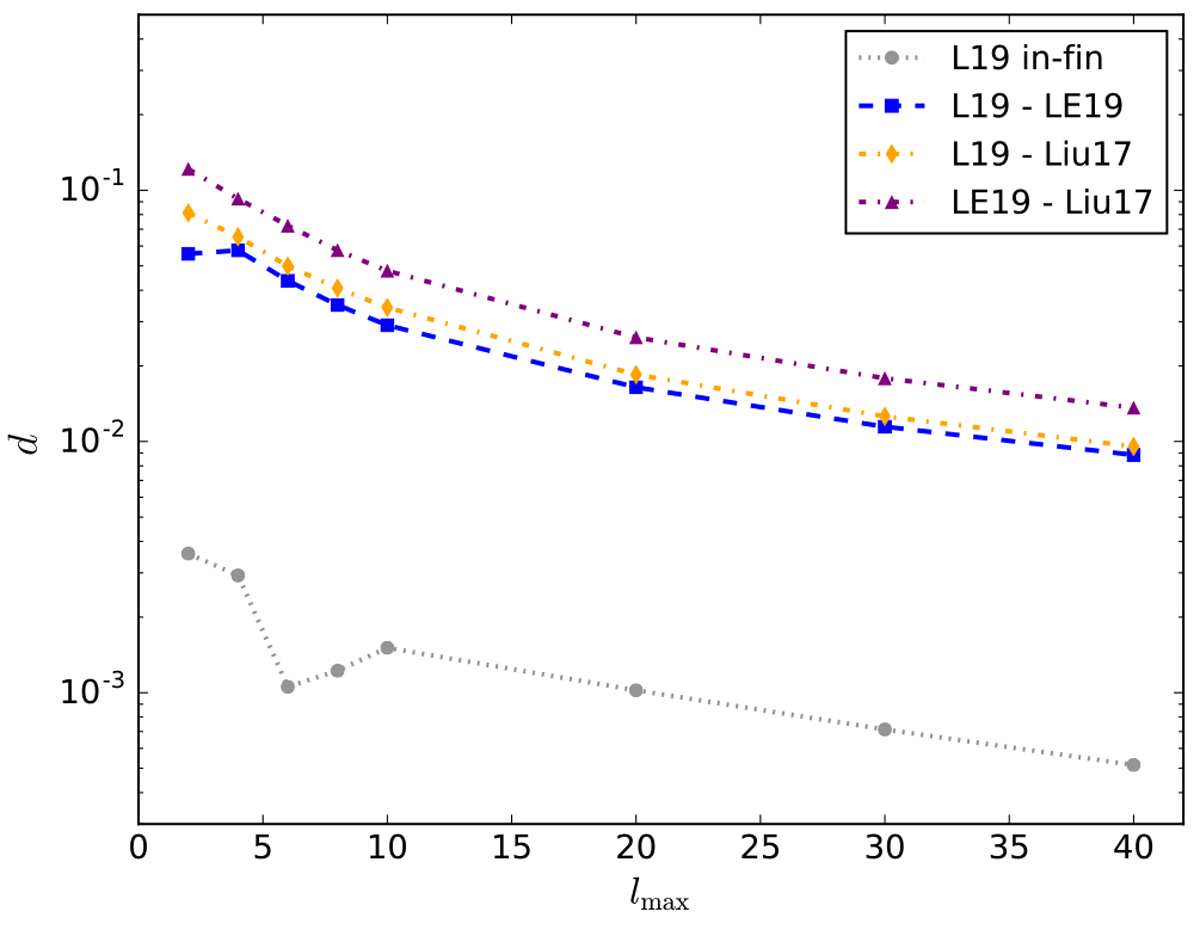
Euclidean distances (d, given by Eq. (1)) between several models of the LB shell inner surface as a function of the maximum multipole degree (lmax). The gray dotted line compares the first and final iterations of the iterative procedure discussed in Sect. 2.2.2 and applied to the L19 data. The blue dashed line compares the final models obtained with the L19 and LE19 data. The orange and purple dot-dashed lines compare the final models obtained with the L19 and LE19 data, respectively, with the shape of the LHB from Liu et al. (2017) (see Sect. 2.5).
Current usage metrics show cumulative count of Article Views (full-text article views including HTML views, PDF and ePub downloads, according to the available data) and Abstracts Views on Vision4Press platform.
Data correspond to usage on the plateform after 2015. The current usage metrics is available 48-96 hours after online publication and is updated daily on week days.
Initial download of the metrics may take a while.