Fig. 3
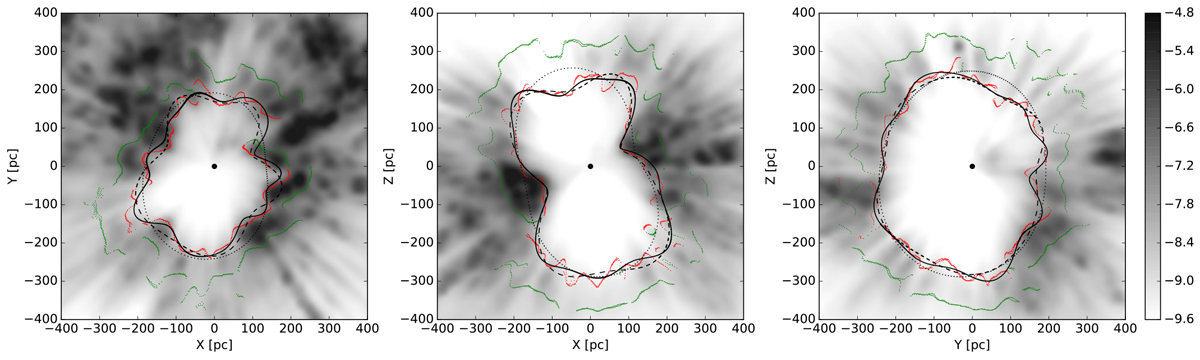
Crosscuts along the planes XY, XZ, and YZ in the L19 3D dust extinction map, with the same conventions as in Fig. 1. The (common) gray scale shows
![]() , with
, with ![]() in units of magnitude per parsec. The red and green lines mark the inner and outer surfaces of the LB shell (rinner and router, respectively), as extracted from the L19 map (Sect. 2.2.1). The black dotted, dashed, and solid lines trace our models of the inner surface (rLB), as obtained through a spherical harmonic expansion up to lmax = 2, 6 and 10, respectively (Sect. 2.2.2).
in units of magnitude per parsec. The red and green lines mark the inner and outer surfaces of the LB shell (rinner and router, respectively), as extracted from the L19 map (Sect. 2.2.1). The black dotted, dashed, and solid lines trace our models of the inner surface (rLB), as obtained through a spherical harmonic expansion up to lmax = 2, 6 and 10, respectively (Sect. 2.2.2).
Current usage metrics show cumulative count of Article Views (full-text article views including HTML views, PDF and ePub downloads, according to the available data) and Abstracts Views on Vision4Press platform.
Data correspond to usage on the plateform after 2015. The current usage metrics is available 48-96 hours after online publication and is updated daily on week days.
Initial download of the metrics may take a while.