Fig. 6.
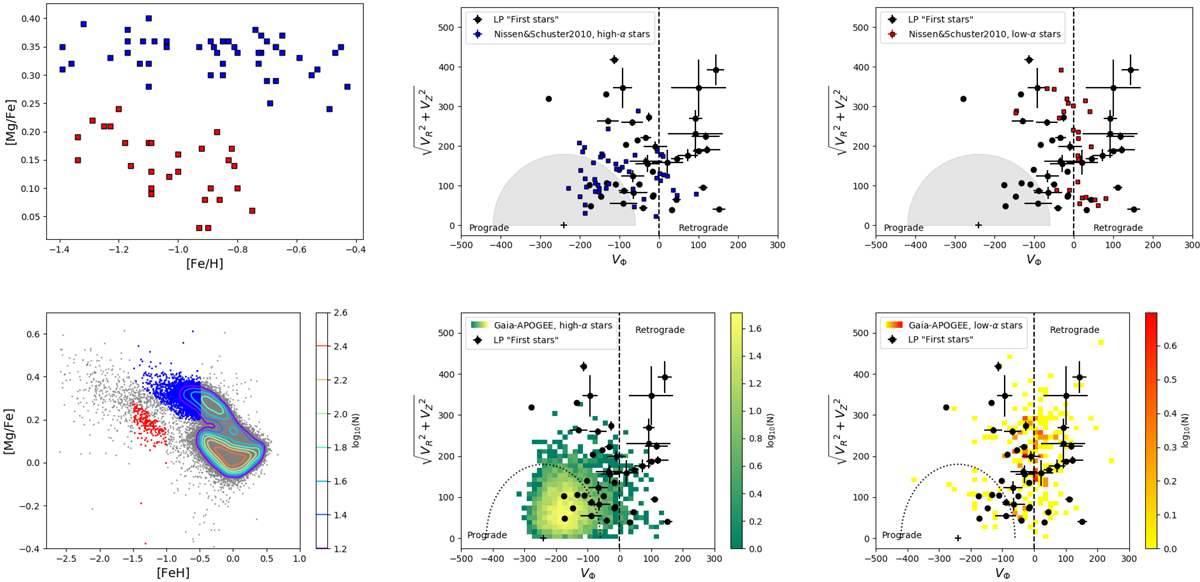
First row, left panel: [Mg/Fe] versus [Fe/H] distribution for stars in Nissen & Schuster (2010) sample. Red colours indicate low-α stars, blue colours indicate high-α (thick disc and halo) stars, following the classification given in Nissen & Schuster (2010). First row, middle panel: Toomre diagram of LP First stars (black dots), and of the high-α (thick disc and halo) stars in the Nissen & Schuster (2010) sample (blue squares). First row, right panel: Toomre diagram of LP First stars (black dots), and of the low-α stars in the Nissen & Schuster (2010) sample (red squares). The grey area in this panel and in the previous one separates stars with ![]() km s−1 from stars with higher relative velocities with respect to the LSR. The vertical dashed lines separate prograde from retrograde motions. Second row, left panel: [Mg/Fe] versus [Fe/H] distribution for stars in the Gaia DR2-APOGEE sample. The distribution of the whole sample is shown by grey dots and contours, while the distribution of stars selected as in-situ, high-α stars and accreted, low-α stars are shown, respectively, with blue and red dots. Second row, middle panel: Toomre diagram of LP First stars (black dots), and of the high-α stars in the Gaia DR2-APOGEE sample (density map). Second row, right panel: Toomre diagram of LP First stars (black dots), and of the low-α stars in the Gaia DR2-APOGEE sample (density map). The grey dashed curve in this panel and in the previous one separates stars with
km s−1 from stars with higher relative velocities with respect to the LSR. The vertical dashed lines separate prograde from retrograde motions. Second row, left panel: [Mg/Fe] versus [Fe/H] distribution for stars in the Gaia DR2-APOGEE sample. The distribution of the whole sample is shown by grey dots and contours, while the distribution of stars selected as in-situ, high-α stars and accreted, low-α stars are shown, respectively, with blue and red dots. Second row, middle panel: Toomre diagram of LP First stars (black dots), and of the high-α stars in the Gaia DR2-APOGEE sample (density map). Second row, right panel: Toomre diagram of LP First stars (black dots), and of the low-α stars in the Gaia DR2-APOGEE sample (density map). The grey dashed curve in this panel and in the previous one separates stars with ![]() km s−1 from stars with higher relative velocities with respect to the LSR. The vertical dashed lines separate prograde from retrograde motions.
km s−1 from stars with higher relative velocities with respect to the LSR. The vertical dashed lines separate prograde from retrograde motions.
Current usage metrics show cumulative count of Article Views (full-text article views including HTML views, PDF and ePub downloads, according to the available data) and Abstracts Views on Vision4Press platform.
Data correspond to usage on the plateform after 2015. The current usage metrics is available 48-96 hours after online publication and is updated daily on week days.
Initial download of the metrics may take a while.