Fig. 3.
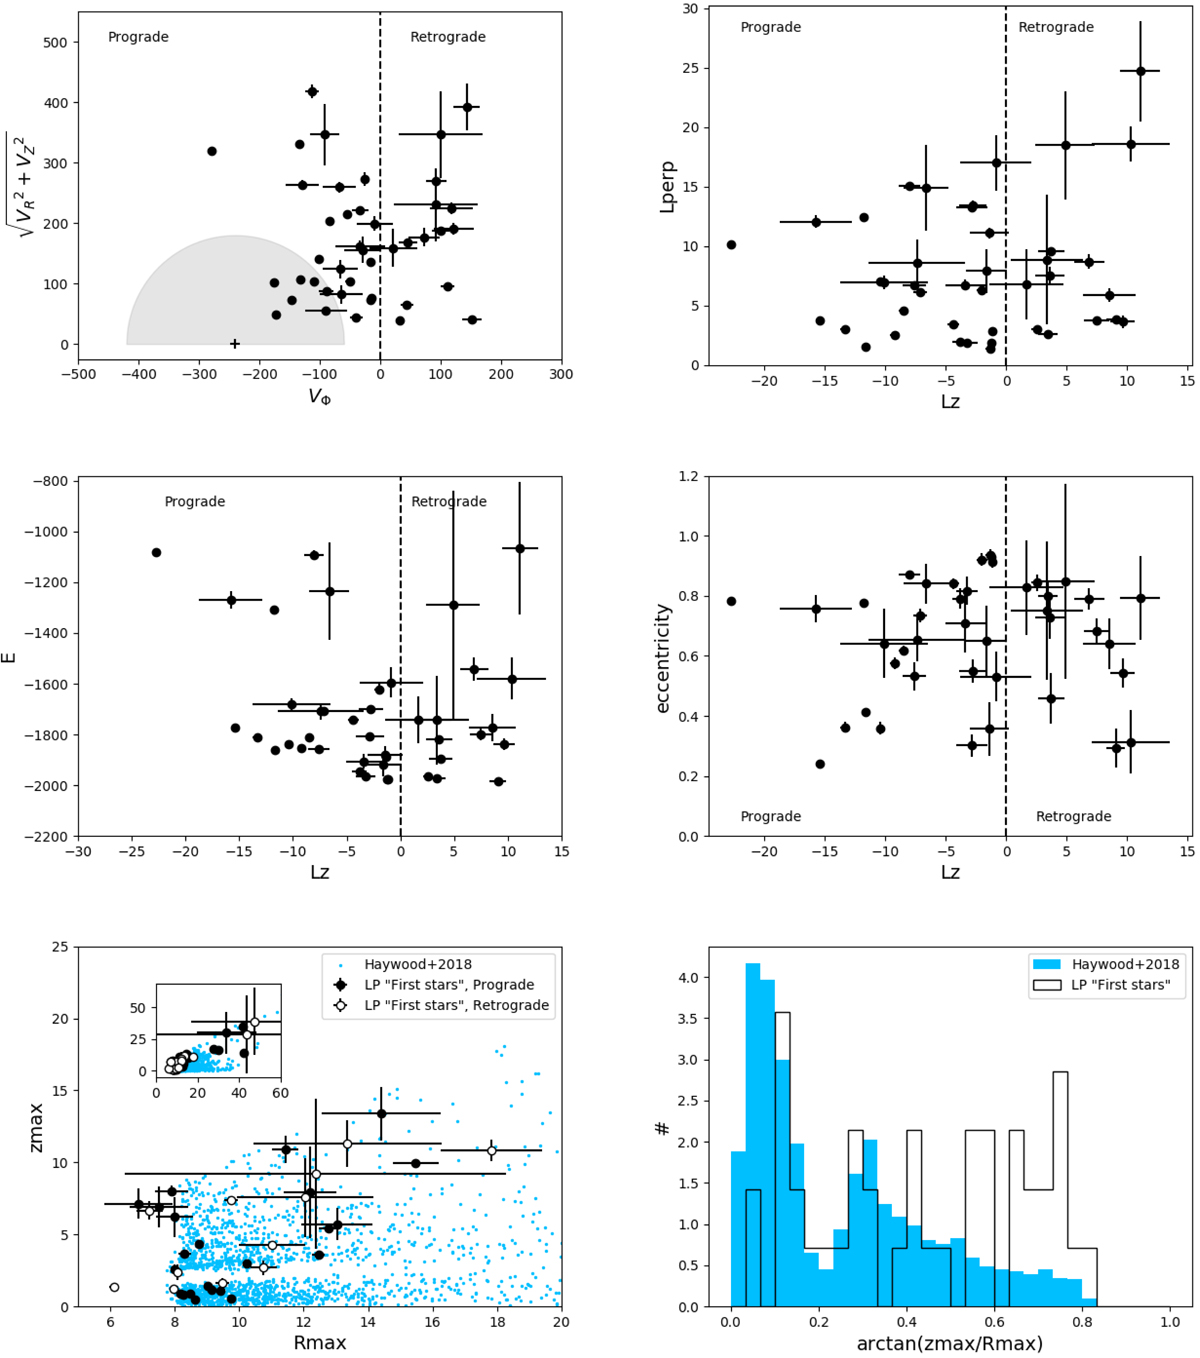
Top-left panel: Toomre diagram for stars in LP sample. The vertical dashed line separates prograde from retrograde motions. Velocities are in units of km/s. The grey area separates stars with ![]() km s−1 from stars with higher relative velocities with respect to the LSR. Top-right panel: distribution of the LP First stars in the Lz − Lperp plane. Angular momenta are in units of 100 kpc km s−1. Middle-left panel: distribution of LP First stars in the E − Lz plane. The vertical dashed line separates prograde from retrograde motions. Angular momenta are in units of 100 kpc km s−1, energies in units of 100 km2 s−2. Middle-right panel: distribution of LP First stars in the eccentricity-Lz plane. Bottom-left panel: distribution of stars in the zmax − Rmax plane. The inset shows the whole distribution, over 60 kpc from the Galactic centre, while the main panel shows a zoom in the innermost 20 kpc. Filled symbols indicate stars with prograde orbits, empty symbols stars with retrograde orbits. Blue points show the comparison with the sample of stars analysed by Haywood et al. (2018). Units are in kpc. Bottom-right panel: normalised distribution of the arctan(zmax/Rmax) for stars in the LP sample (black histogram), compared to stars studied by Haywood et al. (2018; blue histogram). In all panels, uncertainties have been estimated as described in Sect. 3.1.
km s−1 from stars with higher relative velocities with respect to the LSR. Top-right panel: distribution of the LP First stars in the Lz − Lperp plane. Angular momenta are in units of 100 kpc km s−1. Middle-left panel: distribution of LP First stars in the E − Lz plane. The vertical dashed line separates prograde from retrograde motions. Angular momenta are in units of 100 kpc km s−1, energies in units of 100 km2 s−2. Middle-right panel: distribution of LP First stars in the eccentricity-Lz plane. Bottom-left panel: distribution of stars in the zmax − Rmax plane. The inset shows the whole distribution, over 60 kpc from the Galactic centre, while the main panel shows a zoom in the innermost 20 kpc. Filled symbols indicate stars with prograde orbits, empty symbols stars with retrograde orbits. Blue points show the comparison with the sample of stars analysed by Haywood et al. (2018). Units are in kpc. Bottom-right panel: normalised distribution of the arctan(zmax/Rmax) for stars in the LP sample (black histogram), compared to stars studied by Haywood et al. (2018; blue histogram). In all panels, uncertainties have been estimated as described in Sect. 3.1.
Current usage metrics show cumulative count of Article Views (full-text article views including HTML views, PDF and ePub downloads, according to the available data) and Abstracts Views on Vision4Press platform.
Data correspond to usage on the plateform after 2015. The current usage metrics is available 48-96 hours after online publication and is updated daily on week days.
Initial download of the metrics may take a while.