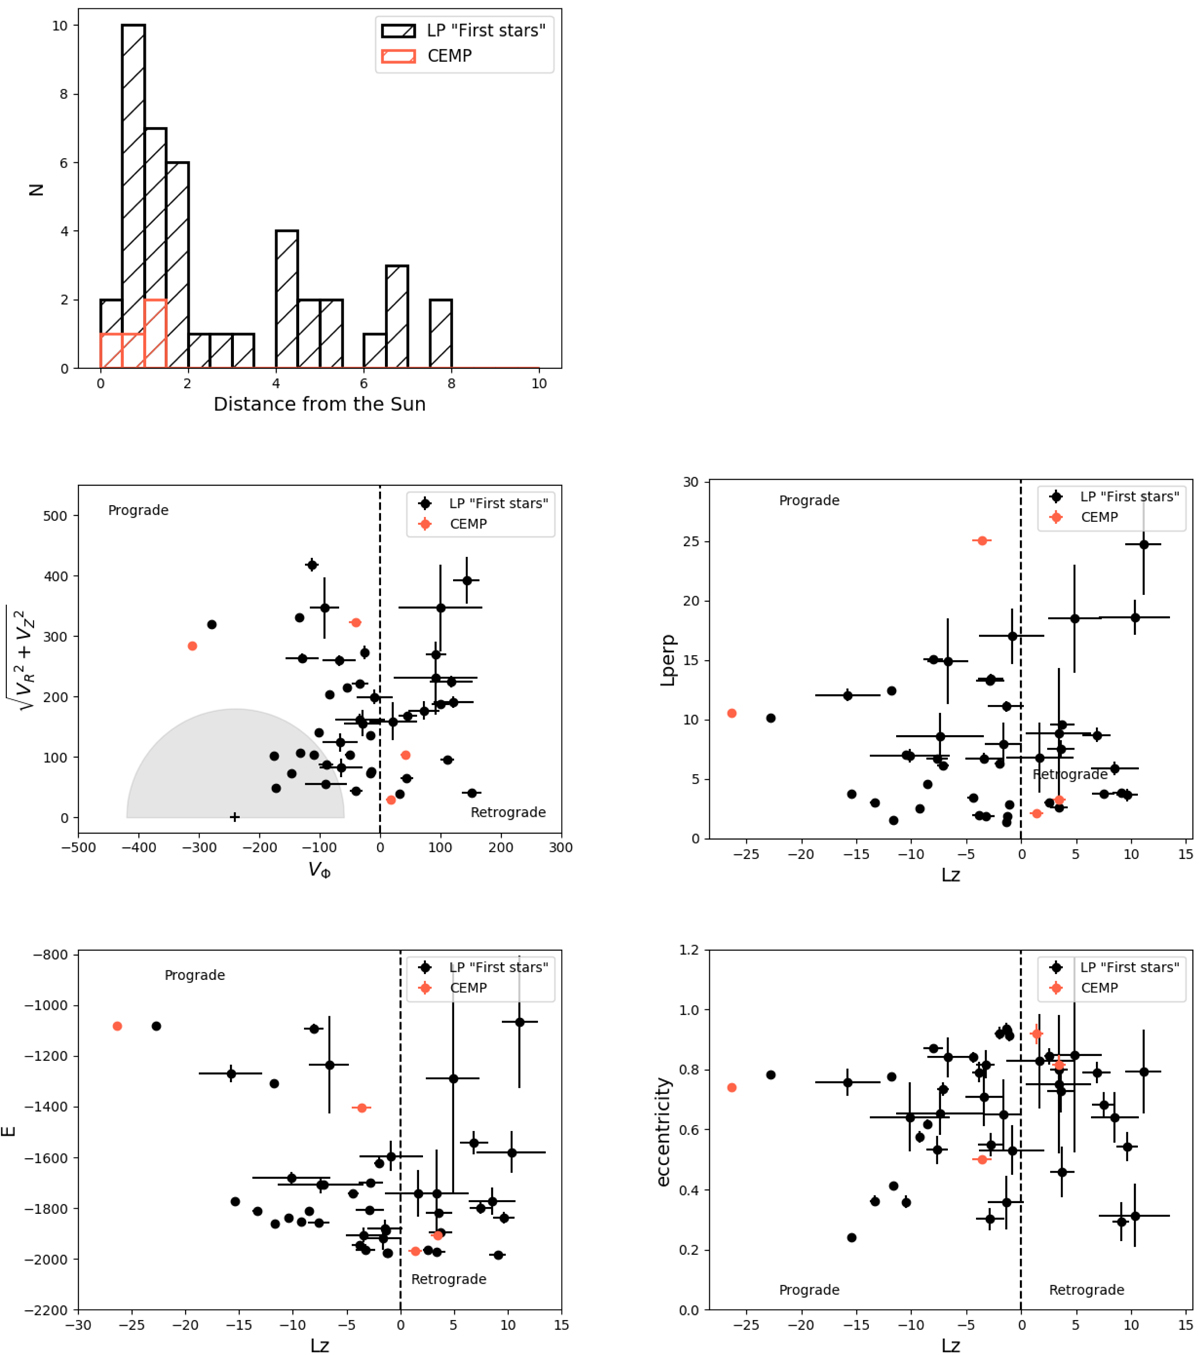
Fig. A.1.
Top row: histogram (hatched orange) of distances (in kpc) to the Sun, of the sample of CEMP stars in the ESO LP First stars, with Gaia DR2 relative errors on parallaxes smaller than 20%. For comparison, the histogram of the distances to the Sun of stars in the LP First stars studied in this paper, is also shown (hatched black). Middle row, left panel: Toomre diagram for CEMP stars (orange dots). Stars from the LP First stars sample studied in this paper are also shown (black dots). The vertical dashed line separates prograde from retrograde motions. Velocities are in units of km/s. The grey area separates stars with ![]() km s−1 from stars with higher relative velocities with respect to the LSR. Middle row, right panel: distribution of the CEMP stars (orange dots) in the Lz − Lperp plane. Stars from the LP First stars sample studied in this paper are also shown (black dots). Angular momenta are in units of 100 kpc km s−1. Bottom row, left panel: distribution of CEMP stars (orange dots) in the E − Lz plane. Stars from the LP First stars sample studied in this paper are also shown (black dots). The vertical dashed line separates prograde from retrograde motions. Angular momenta are in units of 100 kpc km s−1, energies in units of 100 km2 s−2. Bottom row, right panel: distribution of CEMP stars (orange dots) in the eccentricity− Lz plane. Stars from the LP First stars sample studied in this paper are also shown (black dots).
km s−1 from stars with higher relative velocities with respect to the LSR. Middle row, right panel: distribution of the CEMP stars (orange dots) in the Lz − Lperp plane. Stars from the LP First stars sample studied in this paper are also shown (black dots). Angular momenta are in units of 100 kpc km s−1. Bottom row, left panel: distribution of CEMP stars (orange dots) in the E − Lz plane. Stars from the LP First stars sample studied in this paper are also shown (black dots). The vertical dashed line separates prograde from retrograde motions. Angular momenta are in units of 100 kpc km s−1, energies in units of 100 km2 s−2. Bottom row, right panel: distribution of CEMP stars (orange dots) in the eccentricity− Lz plane. Stars from the LP First stars sample studied in this paper are also shown (black dots).
Current usage metrics show cumulative count of Article Views (full-text article views including HTML views, PDF and ePub downloads, according to the available data) and Abstracts Views on Vision4Press platform.
Data correspond to usage on the plateform after 2015. The current usage metrics is available 48-96 hours after online publication and is updated daily on week days.
Initial download of the metrics may take a while.