Fig. 5.
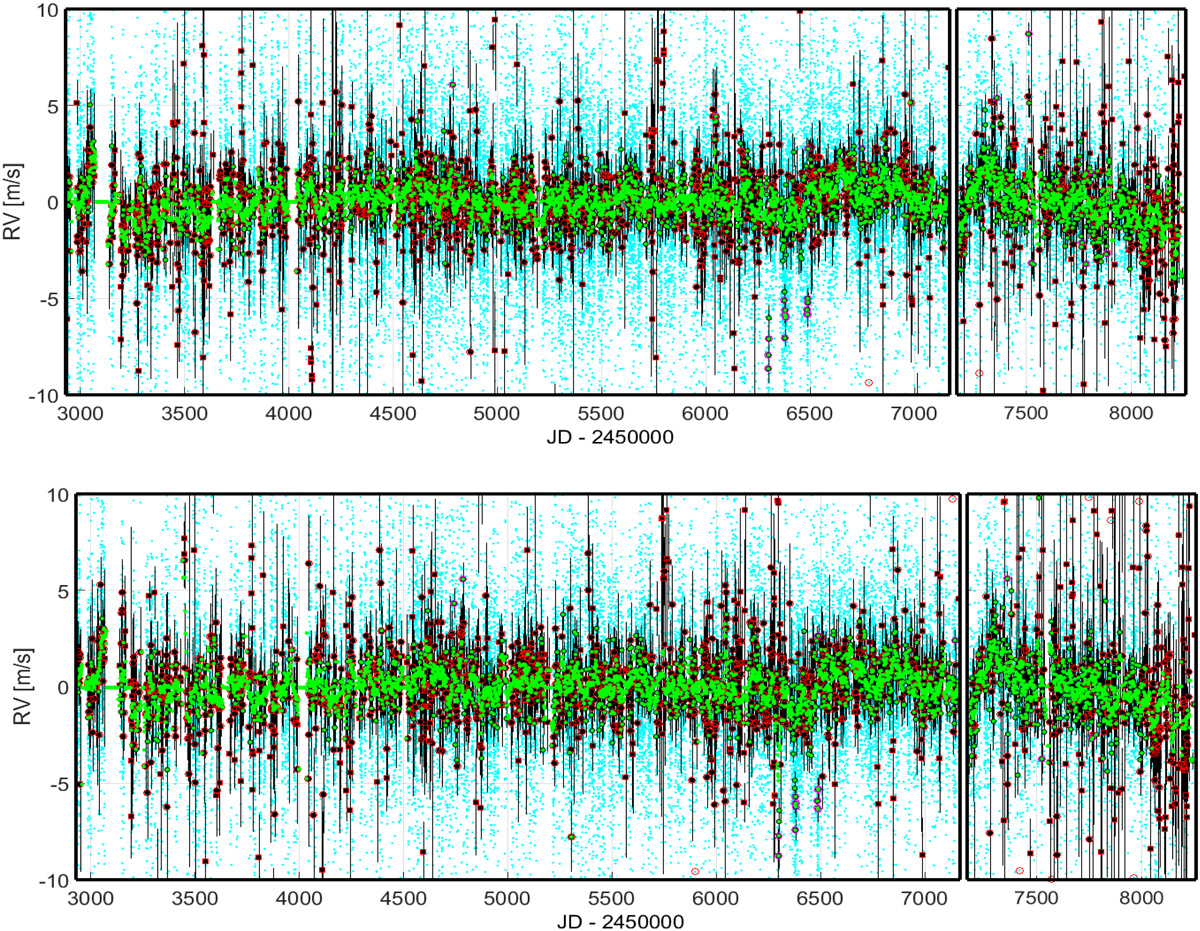
HARPS NZPs based on SERVAL RVs (upper panel) and DRS RVs (lower panel). The stellar zero-point subtracted RVs (cyan dots) of all RV-quiet stars have been averaged in each night (NZPs, black points). NZPs calculated with too few RVs (nRV,n < 3, red boxes) or NZPs with too large uncertainties (≳1 m s−1, red circles) are excluded from correcting the stellar RVs. The RVs in these red-marked nights are corrected for using a smoothed version of the NZP curve, which was calculated with a moving weighted average (21 d window). For significantly deviating NZPs (magenta circles) we adopted their individual (unsmoothed) NZP value, regardless of their uncertainties. The green dots denote for each night the final NZP value that was used for the stellar RV correction. We note the broken x-axis at JD ∼2 457 169 (2015 May 26): because HARPS pre- and HARPS post-NZPs were calculated separately, which also included subtracting each star’s zero-point RV, both time series are centered around ∼0 m s−1 despite the jump in stellar absolute RVs (see Sect. 4.3). The RV axis was limited to ±10 m s−1 to highlight the small NZP variations.
Current usage metrics show cumulative count of Article Views (full-text article views including HTML views, PDF and ePub downloads, according to the available data) and Abstracts Views on Vision4Press platform.
Data correspond to usage on the plateform after 2015. The current usage metrics is available 48-96 hours after online publication and is updated daily on week days.
Initial download of the metrics may take a while.