Fig. 4.
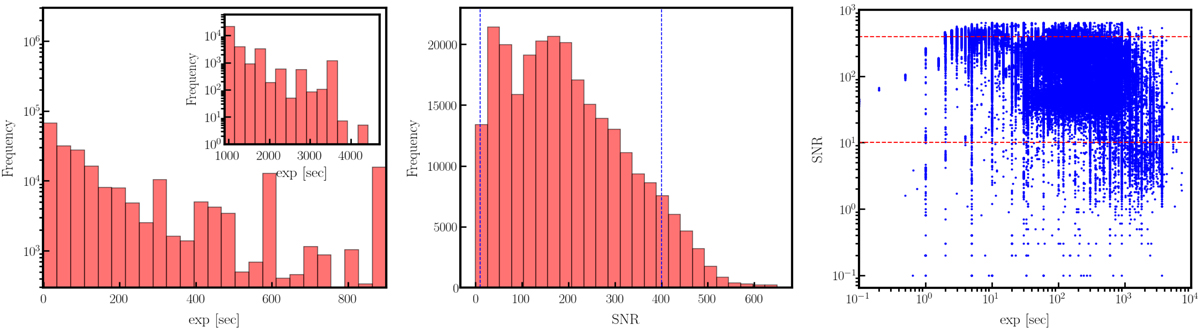
Observation statistics of the HARPS spectra used in this work (∼212 000 spectra). The panels show the distribution of the exposure times (left), the achieved S/N at 550 nm for the obtained spectra (middle), and a scatter plot of the exposure times vs. the S/N (right). The red dashed lines mark the range of S/N adopted in this work to create a template spectrum.
Current usage metrics show cumulative count of Article Views (full-text article views including HTML views, PDF and ePub downloads, according to the available data) and Abstracts Views on Vision4Press platform.
Data correspond to usage on the plateform after 2015. The current usage metrics is available 48-96 hours after online publication and is updated daily on week days.
Initial download of the metrics may take a while.