Open Access
Fig. 3.
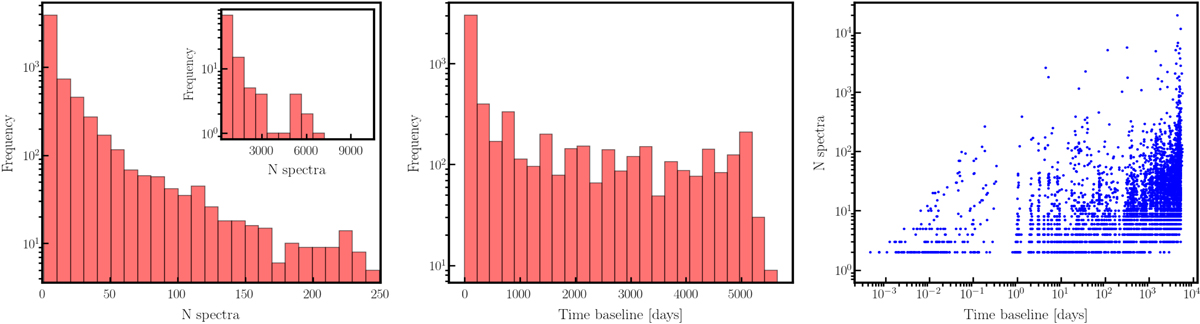
Observation statistics of the HARPS target sample of 5260 stars used in this work. The panels show the distribution of the number of spectra per target (left), the time baselines of the observed targets (middle), and a scatter plot of the time baseline against the number of spectra per target (right).
Current usage metrics show cumulative count of Article Views (full-text article views including HTML views, PDF and ePub downloads, according to the available data) and Abstracts Views on Vision4Press platform.
Data correspond to usage on the plateform after 2015. The current usage metrics is available 48-96 hours after online publication and is updated daily on week days.
Initial download of the metrics may take a while.