Fig. 16.
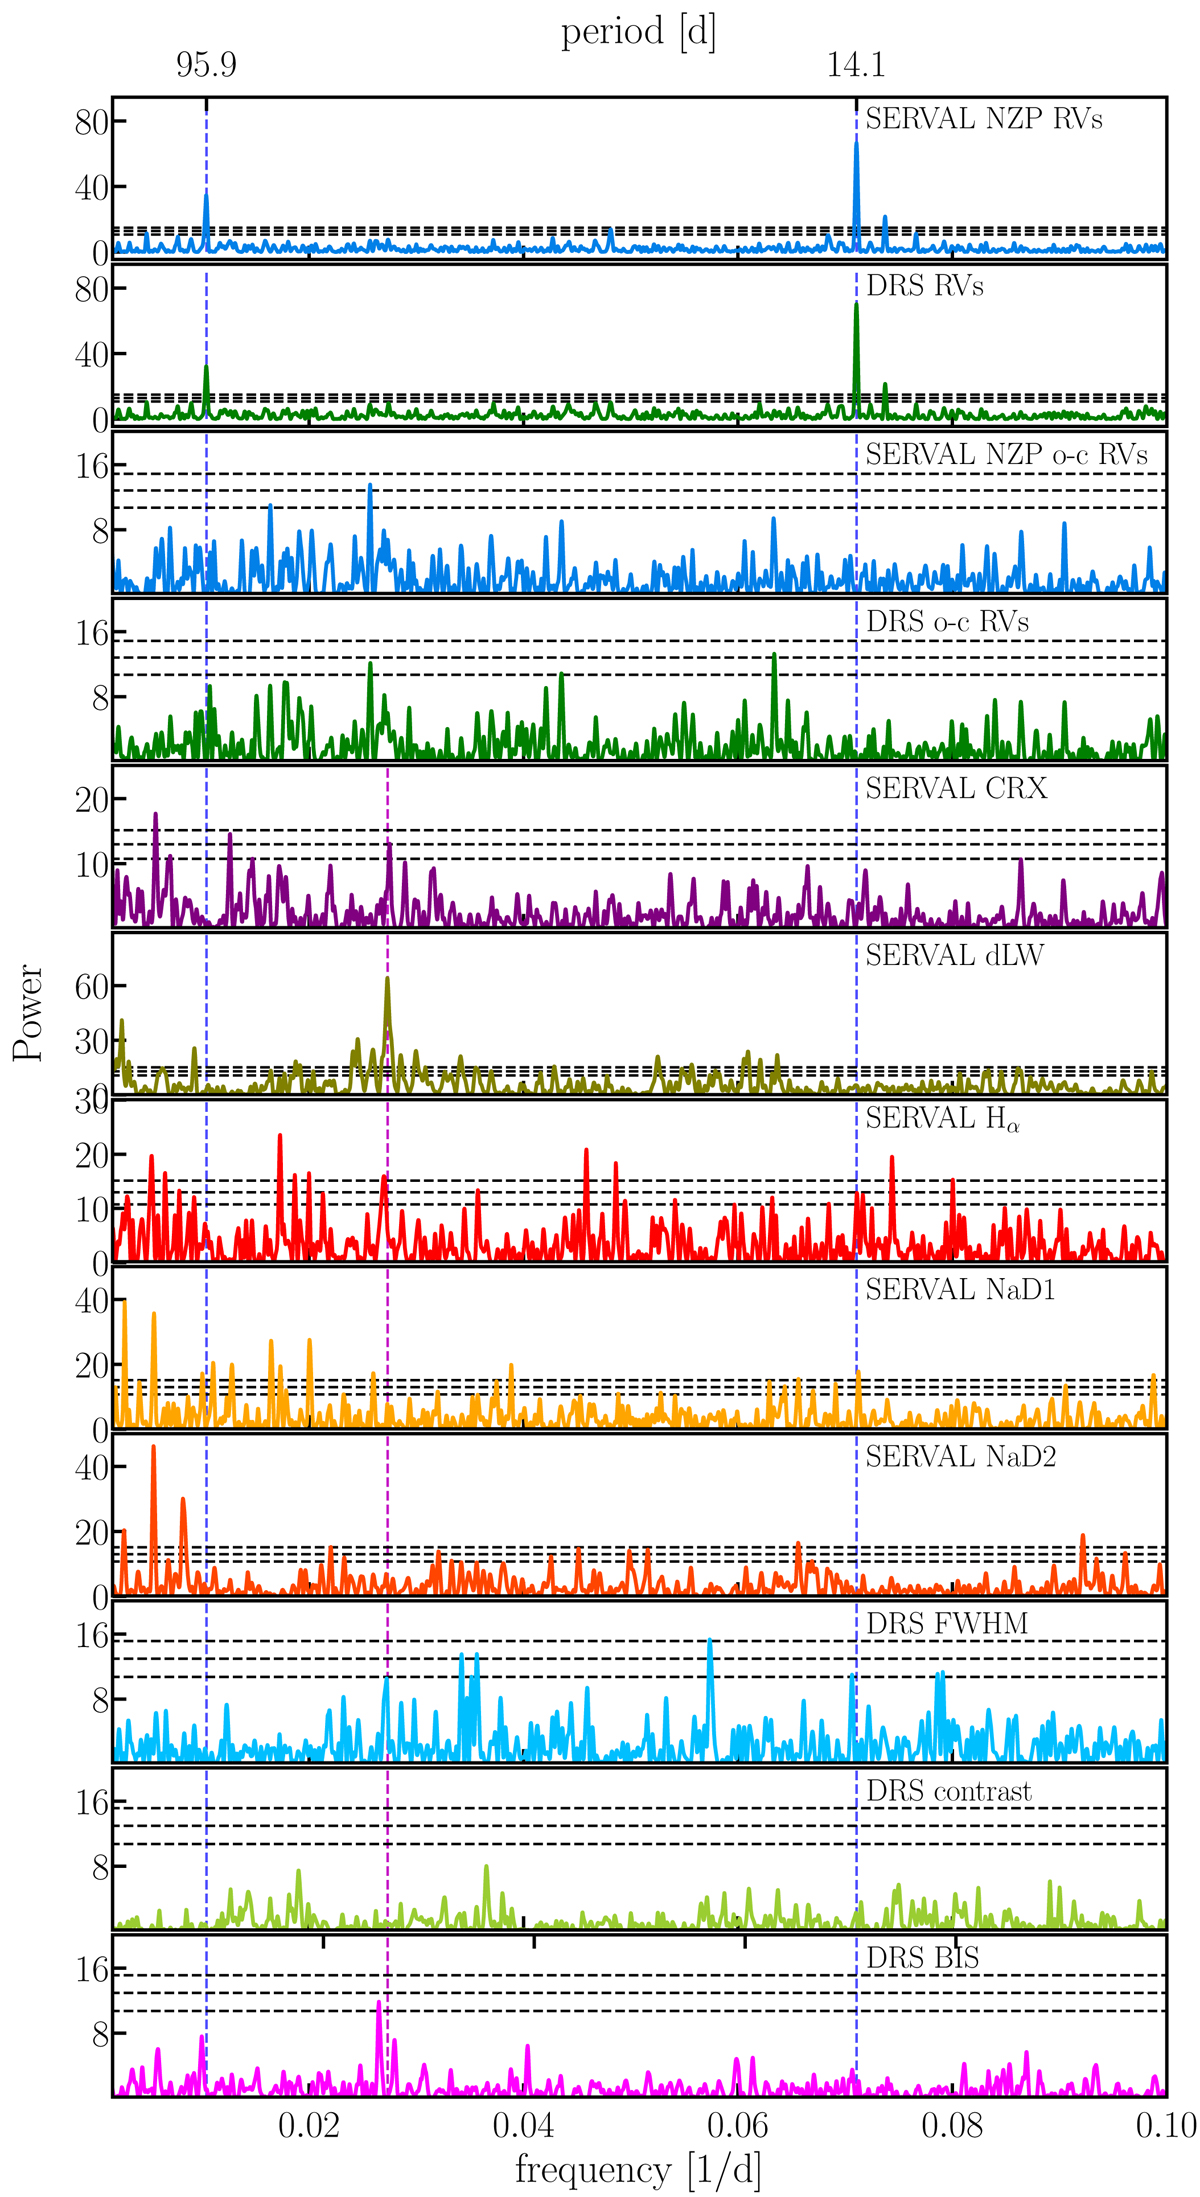
GLS power spectrum for the GJ 253 data, based on NZP-corrected SERVAL RVs, DRS RVs, and stellar activity indicators from DRS and SERVAL as labeled in the panels. The horizontal lines in the GLS periodograms show FAP levels of 10%, 1%, and 0.1%. Blue vertical lines indicate the orbital period of GJ 253 b and c. The magenta vertical line indicates the periodicity near 36 d, which is present in DRS FWHM, BIS-span, contrast, and the SERVAL dLW activity indicators that are likely related to the stellar rotational period.
Current usage metrics show cumulative count of Article Views (full-text article views including HTML views, PDF and ePub downloads, according to the available data) and Abstracts Views on Vision4Press platform.
Data correspond to usage on the plateform after 2015. The current usage metrics is available 48-96 hours after online publication and is updated daily on week days.
Initial download of the metrics may take a while.