Fig. 10.
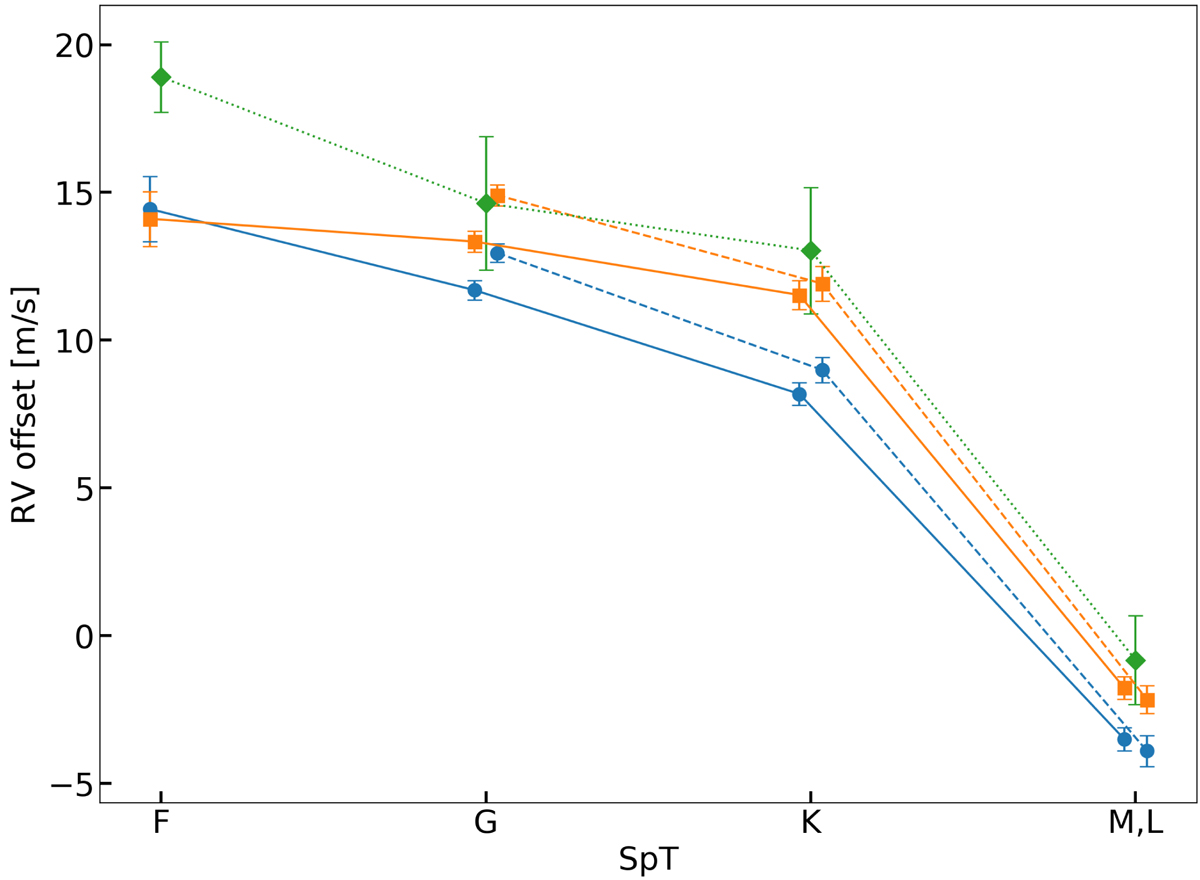
Radial velocity jump estimates from all data sets for different spectral types. The two RV pipelines SERVAL (blue circles) and DRS (orange squares) are color-coded. Offsets reported by Lo Curto et al. (2015) were grouped by spectral type and averaged for comparison (green diamonds). The dashed lines indicate stripped data sets, while the solid lines correspond to the full sets.
Current usage metrics show cumulative count of Article Views (full-text article views including HTML views, PDF and ePub downloads, according to the available data) and Abstracts Views on Vision4Press platform.
Data correspond to usage on the plateform after 2015. The current usage metrics is available 48-96 hours after online publication and is updated daily on week days.
Initial download of the metrics may take a while.