Fig. 7
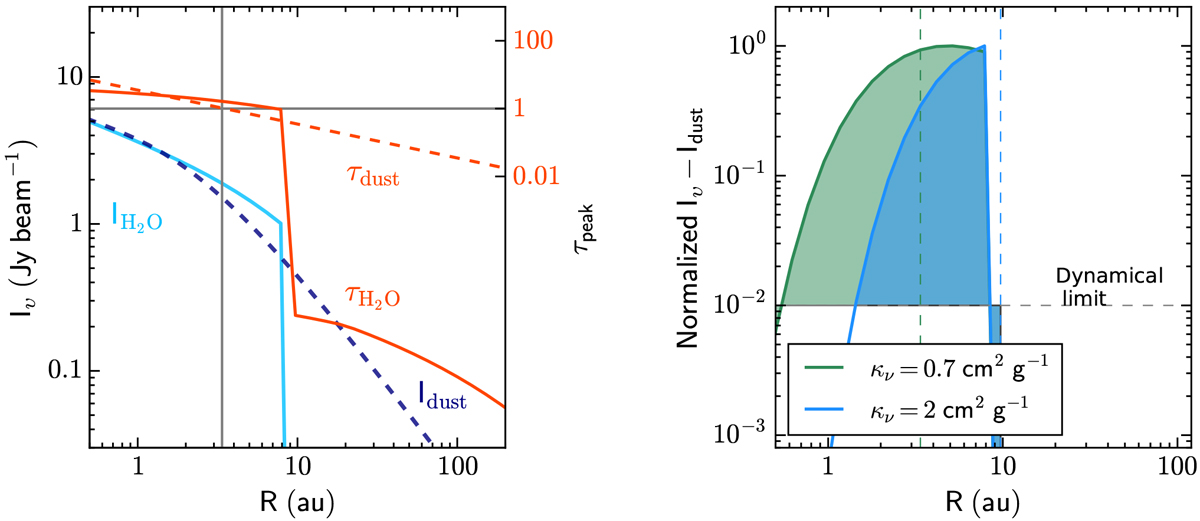
Left: intensity profile normalized to 0.′′75 beam of the H![]() O 31,3–22,0 203 GHz (light blue line) and dust continuum using κ203 GHz = 0.7 cm−2 g−1
(blue dashed line) for a power-law disk model with a water abundance of 10−4 with respect to H2
when Tdust > 100 K (see text). The optical depth of the water line and the dust are shown in solid and dashed red lines, respectively. Horizontal and vertical grey lines indicate the optical depth of one and its location, respectively. These intensity profiles have not been convolved with the synthesized beams. Right: normalized intensity profile including the dust attenuation and dust continuum subtraction. Two dust opacities are used to illustrate the influence of the dust mass absorption coefficient on the emergence of the water line. Vertical lines indicate the radii where the dust optical depth is larger than unity for
κν = 0.7 cm2
g−1 (green) and κν = 2 cm2
g−1 (blue) at 203 GHz. Shaded regions show the simplified effective emitting region due to dynamical limit (S∕N ~ 30 per velocity channel).
O 31,3–22,0 203 GHz (light blue line) and dust continuum using κ203 GHz = 0.7 cm−2 g−1
(blue dashed line) for a power-law disk model with a water abundance of 10−4 with respect to H2
when Tdust > 100 K (see text). The optical depth of the water line and the dust are shown in solid and dashed red lines, respectively. Horizontal and vertical grey lines indicate the optical depth of one and its location, respectively. These intensity profiles have not been convolved with the synthesized beams. Right: normalized intensity profile including the dust attenuation and dust continuum subtraction. Two dust opacities are used to illustrate the influence of the dust mass absorption coefficient on the emergence of the water line. Vertical lines indicate the radii where the dust optical depth is larger than unity for
κν = 0.7 cm2
g−1 (green) and κν = 2 cm2
g−1 (blue) at 203 GHz. Shaded regions show the simplified effective emitting region due to dynamical limit (S∕N ~ 30 per velocity channel).
Current usage metrics show cumulative count of Article Views (full-text article views including HTML views, PDF and ePub downloads, according to the available data) and Abstracts Views on Vision4Press platform.
Data correspond to usage on the plateform after 2015. The current usage metrics is available 48-96 hours after online publication and is updated daily on week days.
Initial download of the metrics may take a while.