Fig. 4
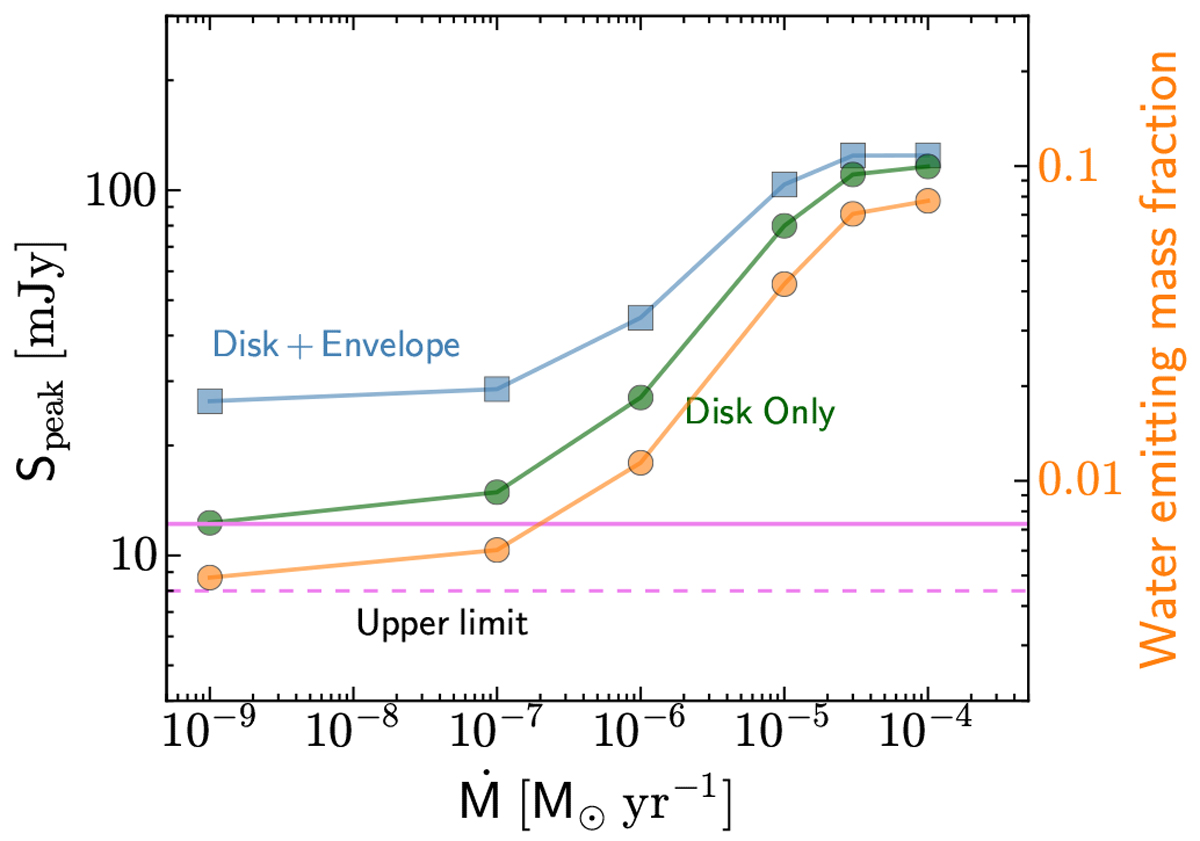
Peak flux density of the H![]() O 31,3–22,0 (203 GHz) as function of the stellar accretion rate. These models are based on the embedded disk models of Harsono et al. (2015) with a central luminosity of
1 L⊙. The blue squares indicate the predicted water emission by taking into account water vapor inside the disk and envelope. The green circles show the expected water flux densities emitted only by the embedded disk. These models adopt a water vapor abundance of 10−4 in the regions where Tdust > 100 K and visual extinction Av > 3 to avoid regions whose emission can be affected by outflowing gas. The predicted line flux densities are calculated via thermalized molecular emission (Eqs. (9) and (10) of Harsono et al. 2015) considering the water column density inside of 25 au radius. From these embedded disk models, the water emitting mass fraction is shown as function of the accretion rate in orange. The upper limit (1σ) for our observations is indicated by the horizontal purple dashed line. The full radiative transfer of water from a generic disk model (see text in Sect. 5.4, Bosman et al., in prep.) is indicated by the purple line to indicate the integrated water flux density for a typical disk in the absence of and accretion heating.
O 31,3–22,0 (203 GHz) as function of the stellar accretion rate. These models are based on the embedded disk models of Harsono et al. (2015) with a central luminosity of
1 L⊙. The blue squares indicate the predicted water emission by taking into account water vapor inside the disk and envelope. The green circles show the expected water flux densities emitted only by the embedded disk. These models adopt a water vapor abundance of 10−4 in the regions where Tdust > 100 K and visual extinction Av > 3 to avoid regions whose emission can be affected by outflowing gas. The predicted line flux densities are calculated via thermalized molecular emission (Eqs. (9) and (10) of Harsono et al. 2015) considering the water column density inside of 25 au radius. From these embedded disk models, the water emitting mass fraction is shown as function of the accretion rate in orange. The upper limit (1σ) for our observations is indicated by the horizontal purple dashed line. The full radiative transfer of water from a generic disk model (see text in Sect. 5.4, Bosman et al., in prep.) is indicated by the purple line to indicate the integrated water flux density for a typical disk in the absence of and accretion heating.
Current usage metrics show cumulative count of Article Views (full-text article views including HTML views, PDF and ePub downloads, according to the available data) and Abstracts Views on Vision4Press platform.
Data correspond to usage on the plateform after 2015. The current usage metrics is available 48-96 hours after online publication and is updated daily on week days.
Initial download of the metrics may take a while.