Fig. 3
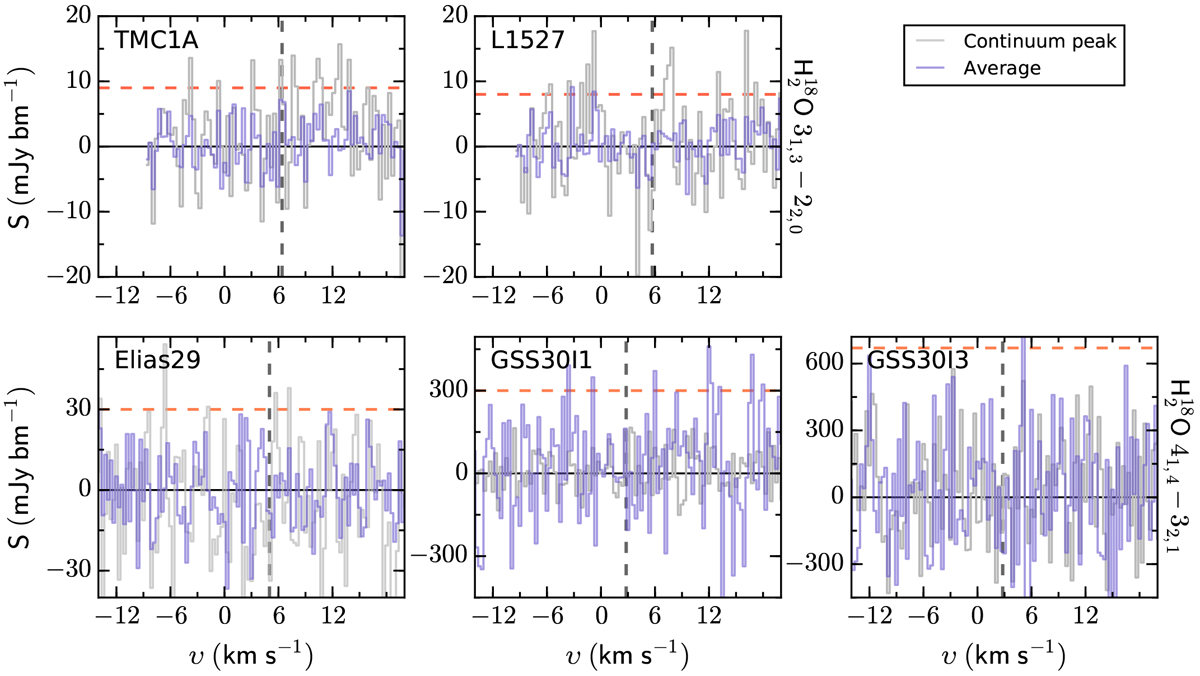
Water spectra toward the Class I young stellar objects. Spectra extracted toward the continuum peak are shown by the gray lines, and the average spectra extracted from a region defined by > 10σ in the dust continuum image is indicated in blue. Vertical black dashed line shows the systemic velocity of the source. Horizontal red line shows the 1σ noise level while the black solid line indicates the baseline.
Current usage metrics show cumulative count of Article Views (full-text article views including HTML views, PDF and ePub downloads, according to the available data) and Abstracts Views on Vision4Press platform.
Data correspond to usage on the plateform after 2015. The current usage metrics is available 48-96 hours after online publication and is updated daily on week days.
Initial download of the metrics may take a while.