Fig. 2
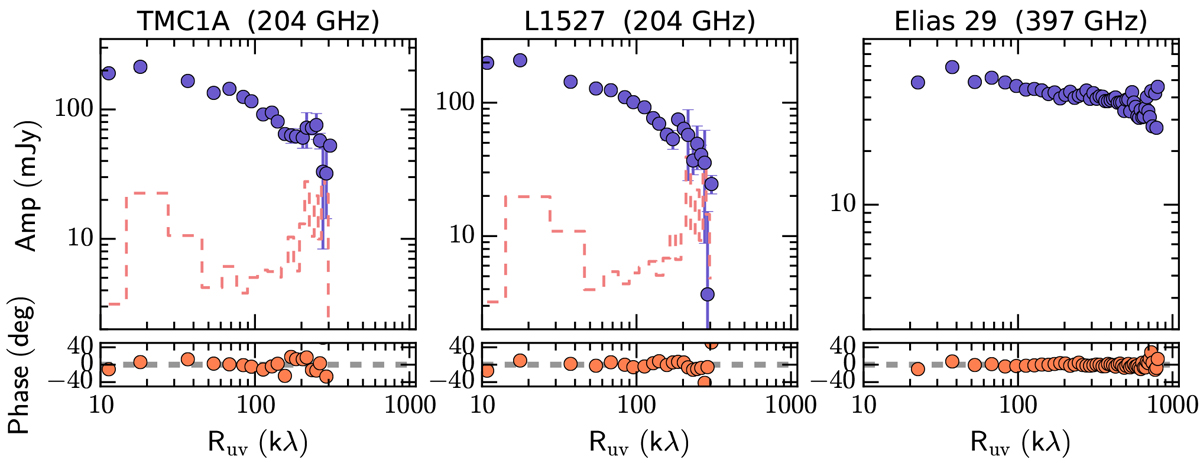
Circularly averaged binned amplitude (top) and phase (bottom) as functions of projected baselines in kλ. Only the visibilities for Elias 29, TMC1A and L1527 are shown as indicated in the top of each panel while the visibilities toward the GSS30 sources are shown in Appendix A. The standard error of each uv bin, which is smaller than the symbol size, is plotted and the expected zero-signal amplitude is also indicated by the red dashed lines. The expected zero-signal amplitude for Elias 29 is more than a factor of 10 lower than the signal.
Current usage metrics show cumulative count of Article Views (full-text article views including HTML views, PDF and ePub downloads, according to the available data) and Abstracts Views on Vision4Press platform.
Data correspond to usage on the plateform after 2015. The current usage metrics is available 48-96 hours after online publication and is updated daily on week days.
Initial download of the metrics may take a while.