Fig. B.1
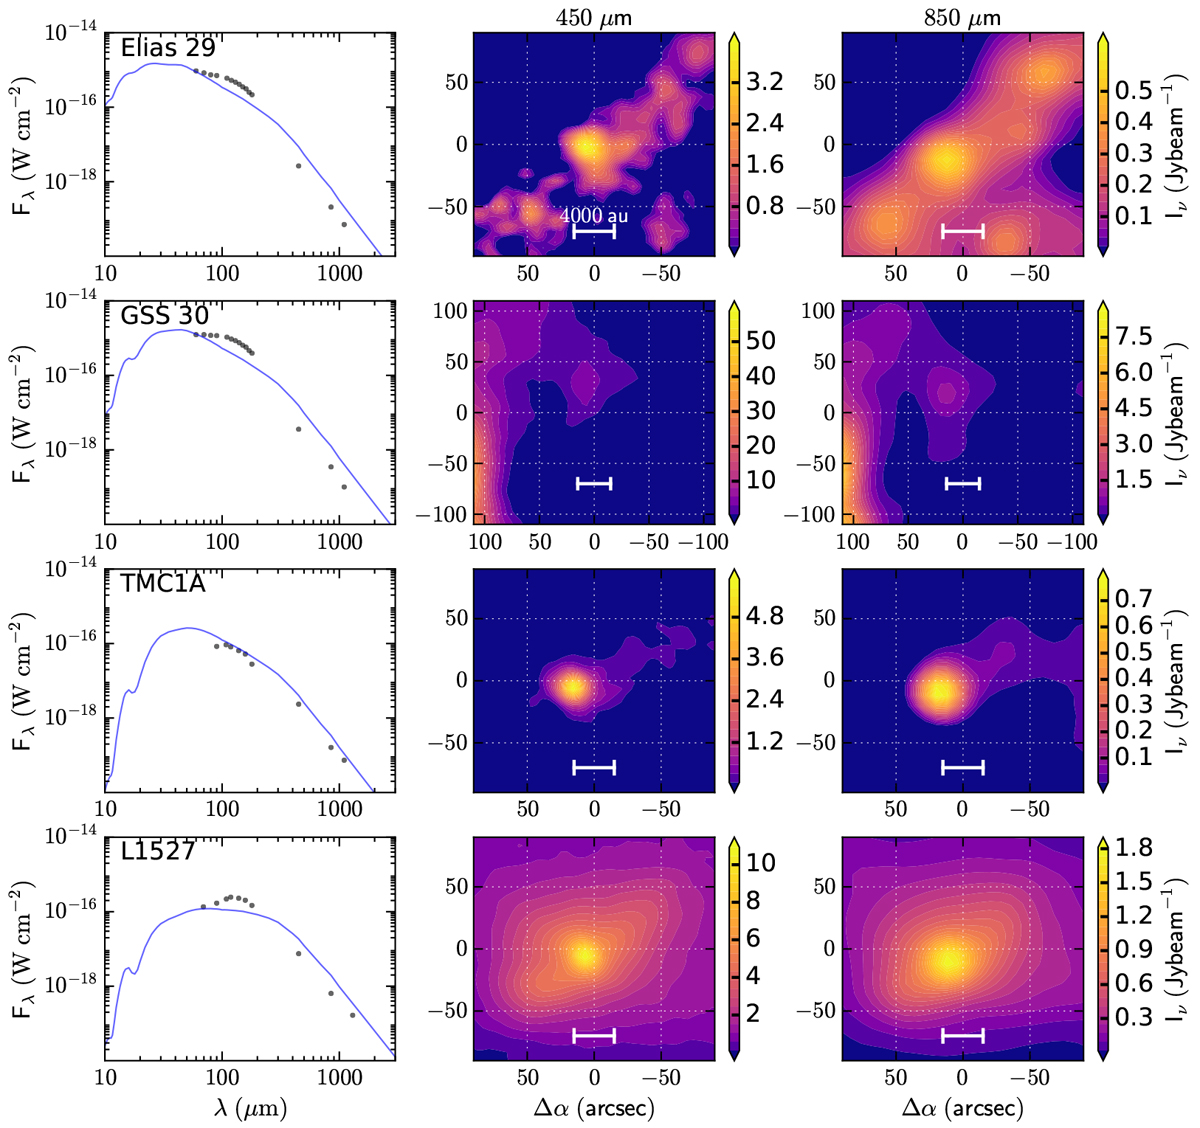
Observed spectral energy distribution (SED, left), SCUBA 450 μm image (middle) and SCUBA 850 μm image (right) for our Class I targets. The best-fit DUSTY model of Kristensen et al. (2012) produces the SED shown with the blue line. The color scale of the 450 and 850 micron maps extends from 10−2 × peak intensity to peak intensity in 24 steps.
Current usage metrics show cumulative count of Article Views (full-text article views including HTML views, PDF and ePub downloads, according to the available data) and Abstracts Views on Vision4Press platform.
Data correspond to usage on the plateform after 2015. The current usage metrics is available 48-96 hours after online publication and is updated daily on week days.
Initial download of the metrics may take a while.