Fig. A.4
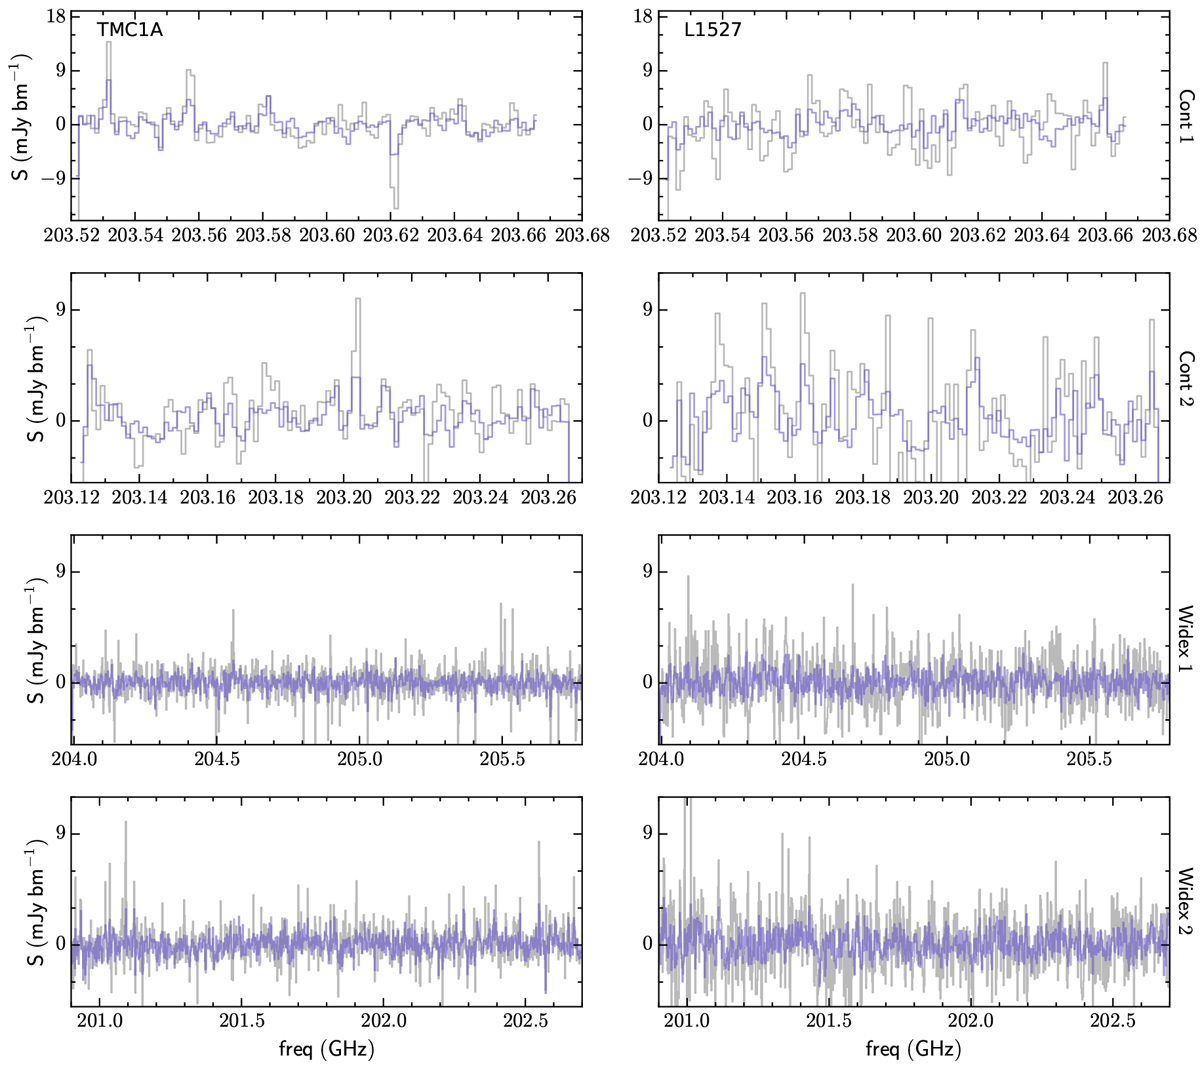
Spectra of the other spectral windows taken with the NOEMA observations at a lower spectral resolution. Some of the emissions are spurious signals due to clean artefacts. For each window, the spectrum is averaged over the dust continuum emission is shown in blue while the spectrum taken at the peak dust continuum position is shown in grey.
Current usage metrics show cumulative count of Article Views (full-text article views including HTML views, PDF and ePub downloads, according to the available data) and Abstracts Views on Vision4Press platform.
Data correspond to usage on the plateform after 2015. The current usage metrics is available 48-96 hours after online publication and is updated daily on week days.
Initial download of the metrics may take a while.