Fig. 1
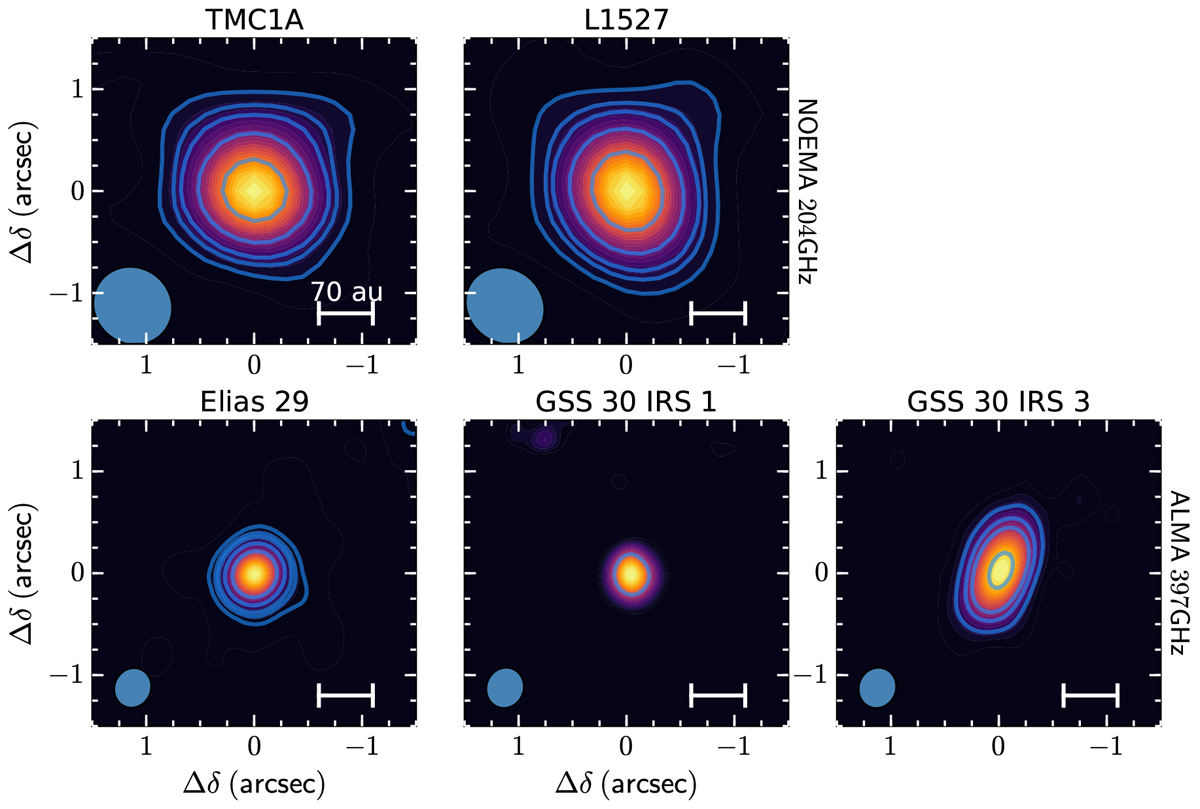
Dust continuum images centered on the phase-centers listed in Table 1. The peak intensities are 93, 83, 44, 33, and 278 mJy beam−1 for TMC1A, L1527, Elias 29, GSS30I1, and GSS30I3, respectively. TMC1A and L1527 are imaged at 203.99 GHz (1.4696 mm) while Elias 29, GSS30I1 and GSS30I3 are observed at 397.25 GHz (754.67 μm). The color scale spans the dust continuum intensities between 1σ to peak intensities with linear spacing. The heavy blue lines indicate the 5, 10, 15, 30 and 60σ contours.
Current usage metrics show cumulative count of Article Views (full-text article views including HTML views, PDF and ePub downloads, according to the available data) and Abstracts Views on Vision4Press platform.
Data correspond to usage on the plateform after 2015. The current usage metrics is available 48-96 hours after online publication and is updated daily on week days.
Initial download of the metrics may take a while.