Open Access
Fig. 9.
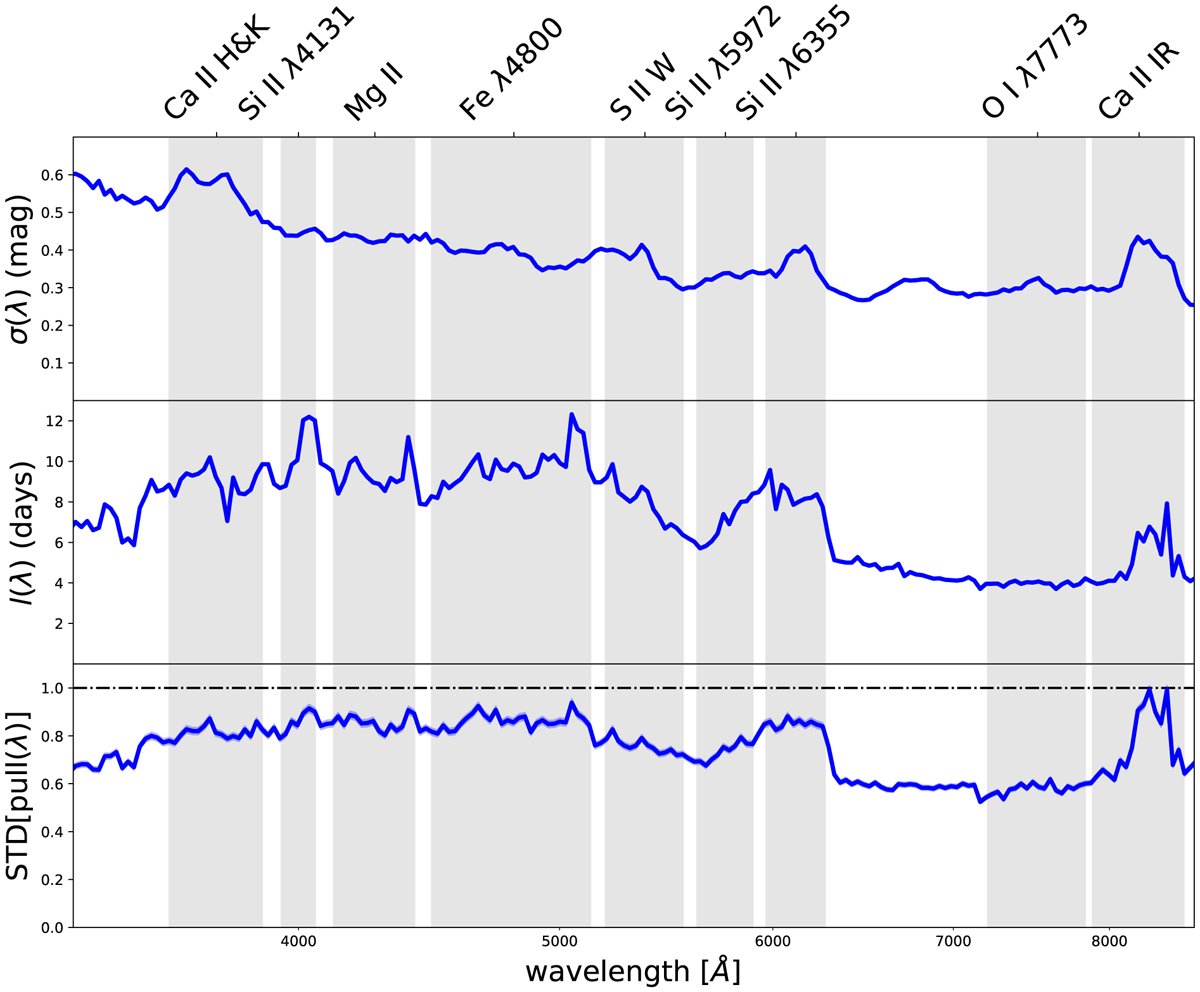
Results of the Gaussian process interpolation. From top to bottom: amplitude of the kernel, correlation length and standard deviation of the pull distribution in terms of wavelength. The gray areas represent the presence of the absorption line that were used in our original factor analysis.
Current usage metrics show cumulative count of Article Views (full-text article views including HTML views, PDF and ePub downloads, according to the available data) and Abstracts Views on Vision4Press platform.
Data correspond to usage on the plateform after 2015. The current usage metrics is available 48-96 hours after online publication and is updated daily on week days.
Initial download of the metrics may take a while.