Fig. 6.
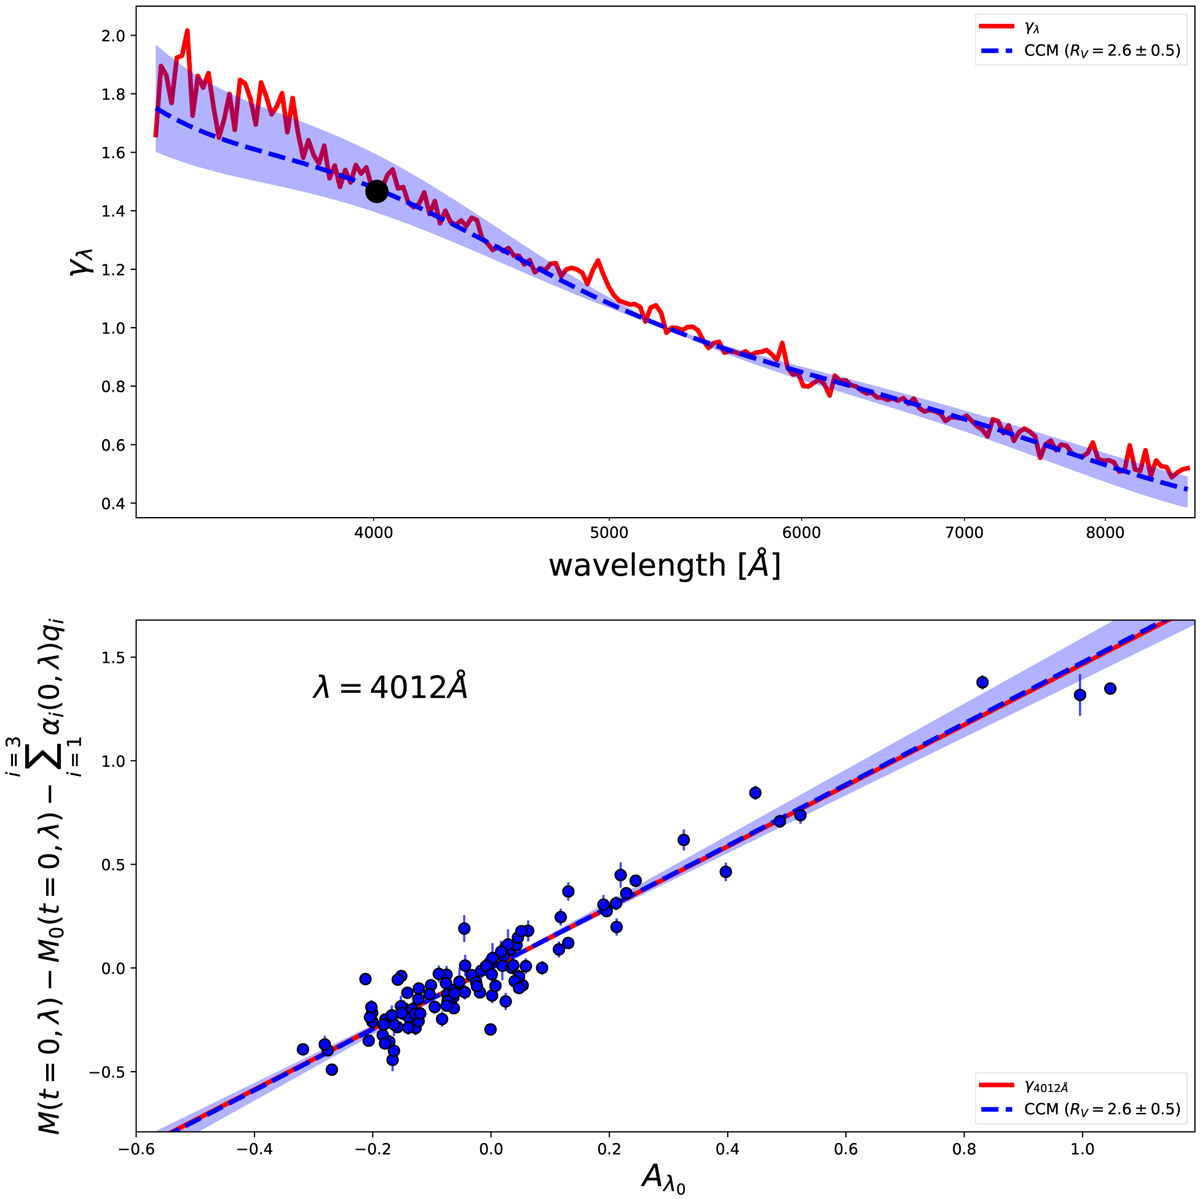
Extinction curve fit result. Top panel: empirical average extinction curve, γ(λ), compared to the best fit by a Cardelli et al. (1989) law, which gives an RV = 2.6. The shaded blue area represent a ±0.5 range on RV, in order to illustrate the typical range of value that are measured for SN Ia in the literature. The black dot on this curve indicates the wavelength used on the lower panel graph. Lower panel: residuals after correction for the intrinsic behavior at 4012 Å as a function of Aλ0. Each dot corresponds to a single SN Ia. The γ4012 Å slope between M and Aλ0 is indicated by the red continuous line. Dashed represent the Cardelli et al. (1989) law for RV = 2.6. The shaded blue area represent a ±0.5 range on RV, in order to illustrate the typical range of value that are measured for SN Ia in the literature.
Current usage metrics show cumulative count of Article Views (full-text article views including HTML views, PDF and ePub downloads, according to the available data) and Abstracts Views on Vision4Press platform.
Data correspond to usage on the plateform after 2015. The current usage metrics is available 48-96 hours after online publication and is updated daily on week days.
Initial download of the metrics may take a while.