Fig. 5.
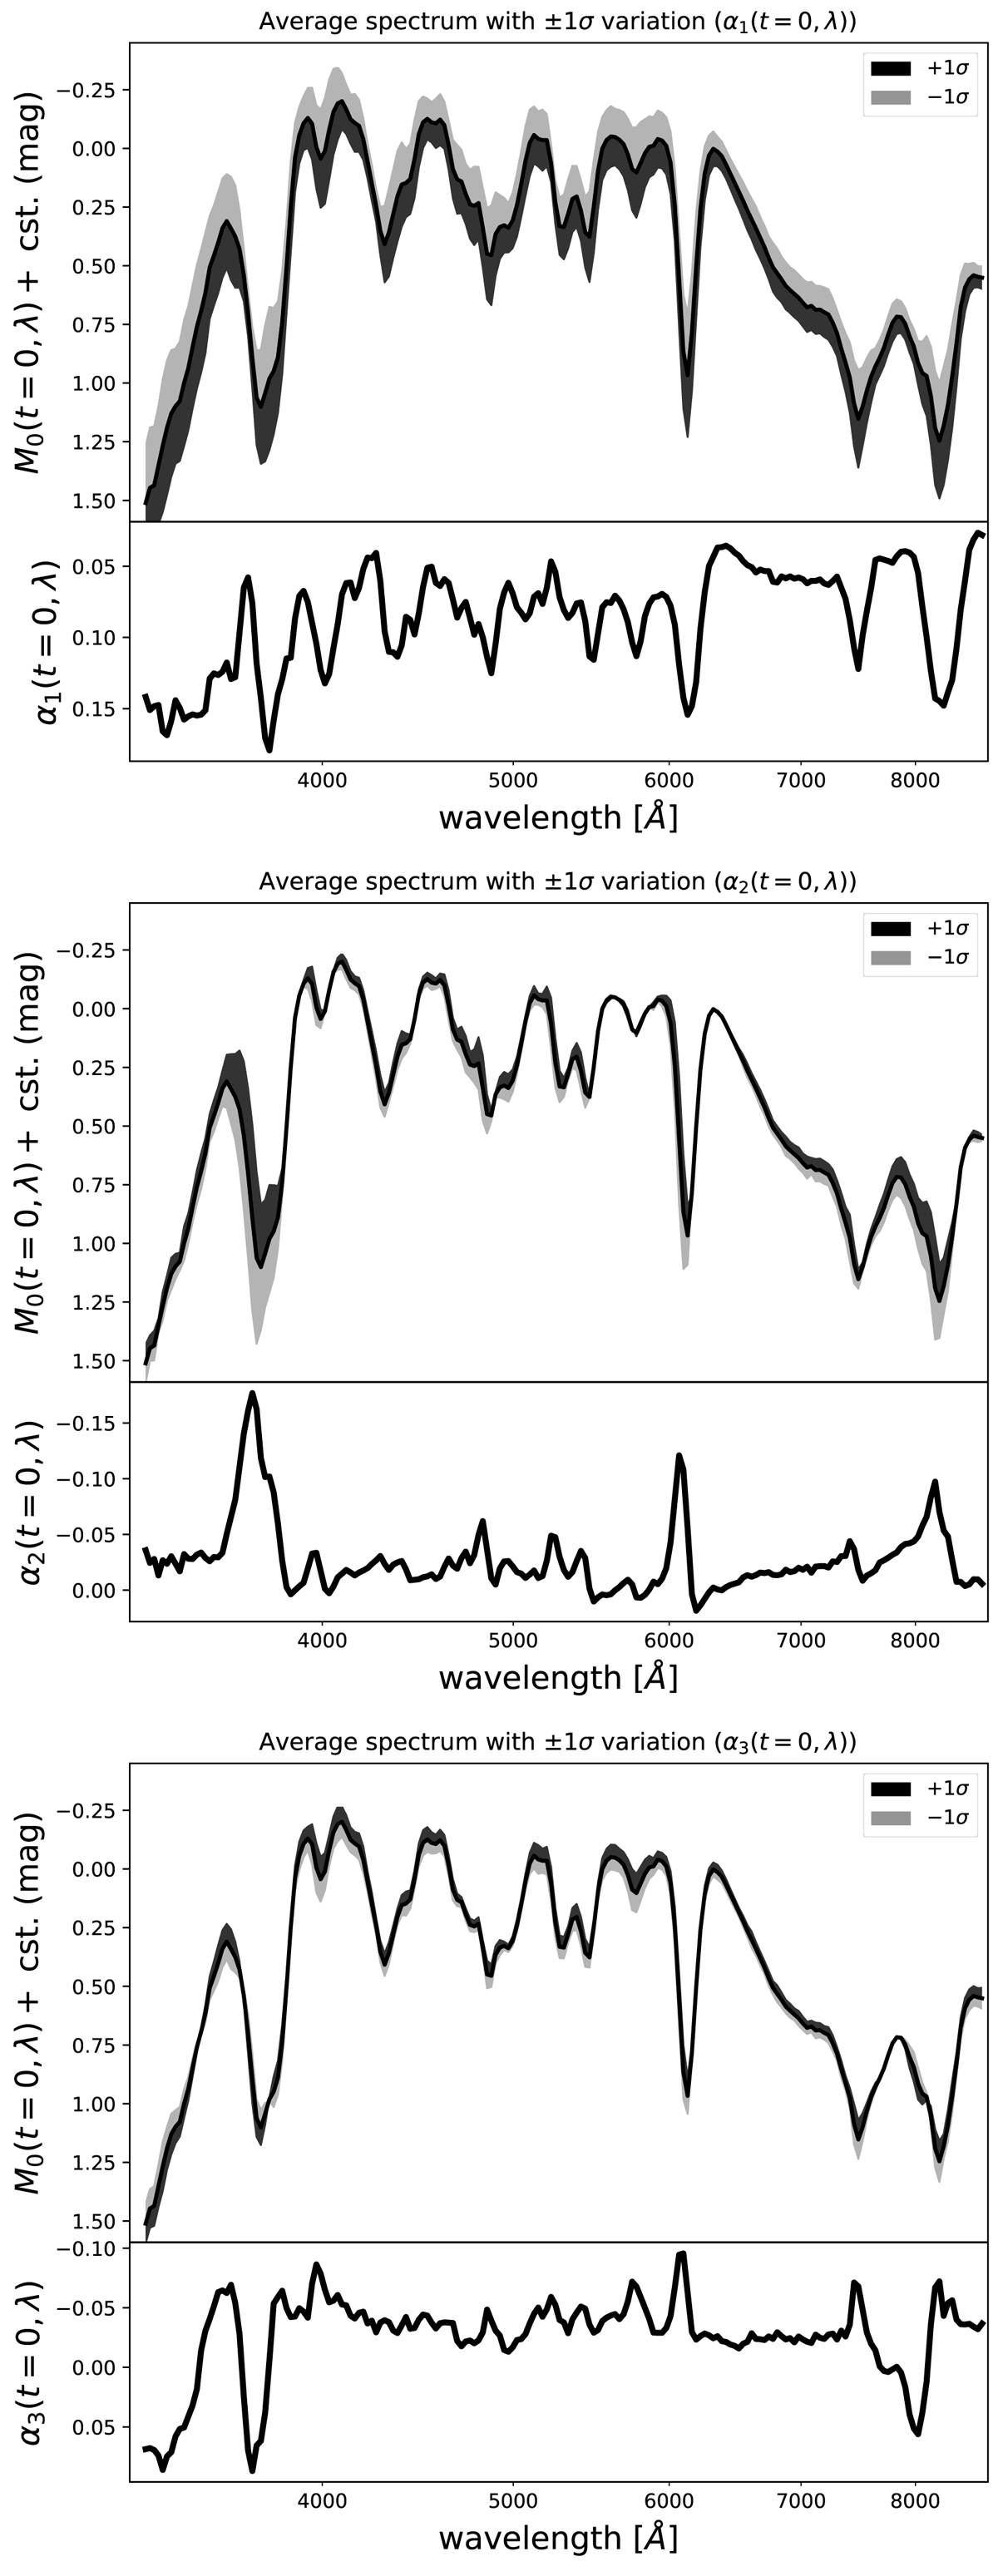
Impact of each component on the average spectrum. Top panel, top: average spectrum M0 and the predicted effect of a variation of q1 by ±1σ. Bottom: corresponding α1 vector. Middle panel, top: average spectrum M0 and the predicted effect of a variation of q2 by ±1σ. Bottom: corresponding α2 vector. Bottom panel, top: average spectrum M0 and the predicted effect of a variation of q2 by ±1σ. Bottom: corresponding α2 vector.
Current usage metrics show cumulative count of Article Views (full-text article views including HTML views, PDF and ePub downloads, according to the available data) and Abstracts Views on Vision4Press platform.
Data correspond to usage on the plateform after 2015. The current usage metrics is available 48-96 hours after online publication and is updated daily on week days.
Initial download of the metrics may take a while.