Fig. 3.
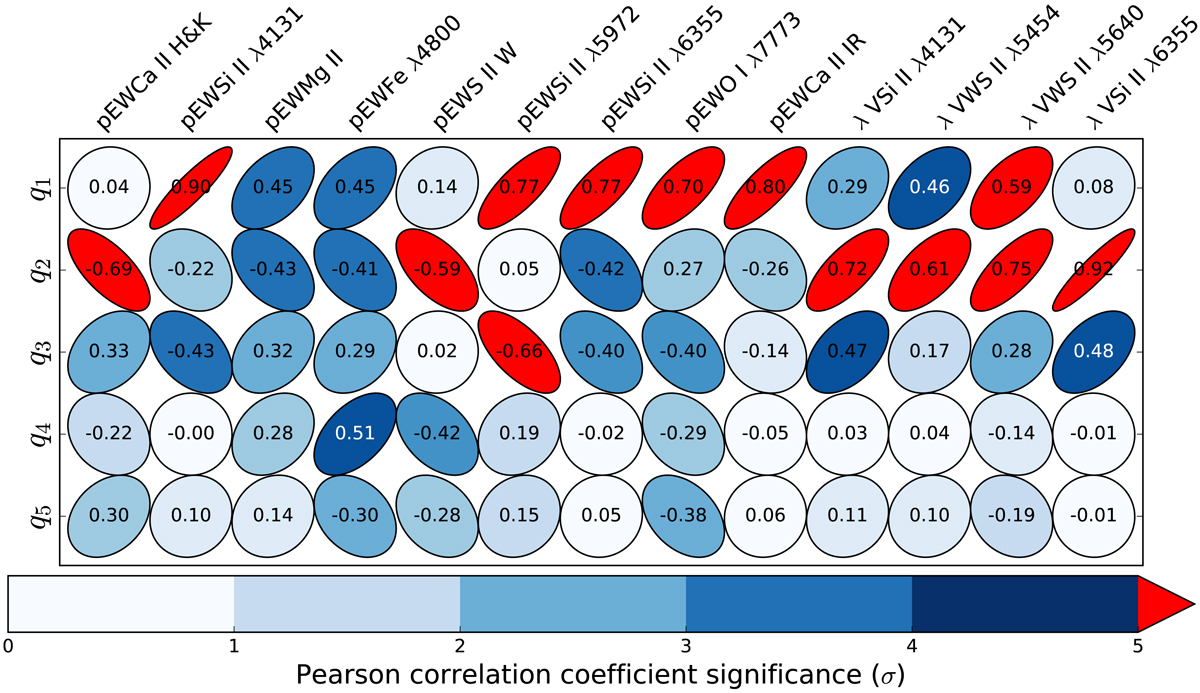
Pearson correlation coefficients between the spectral indicators and the first five factors. The eccentricities of the ellipses indicate the magnitude of the correlation, and the color the importance of the correlation in units of σ. The vectors one and two correspond respectively to a global correlation of the pseudo-equivalent widths and of the line velocities. Only the first three vectors display correlations with a significance higher than 5σ.
Current usage metrics show cumulative count of Article Views (full-text article views including HTML views, PDF and ePub downloads, according to the available data) and Abstracts Views on Vision4Press platform.
Data correspond to usage on the plateform after 2015. The current usage metrics is available 48-96 hours after online publication and is updated daily on week days.
Initial download of the metrics may take a while.