Open Access
Fig. 2.
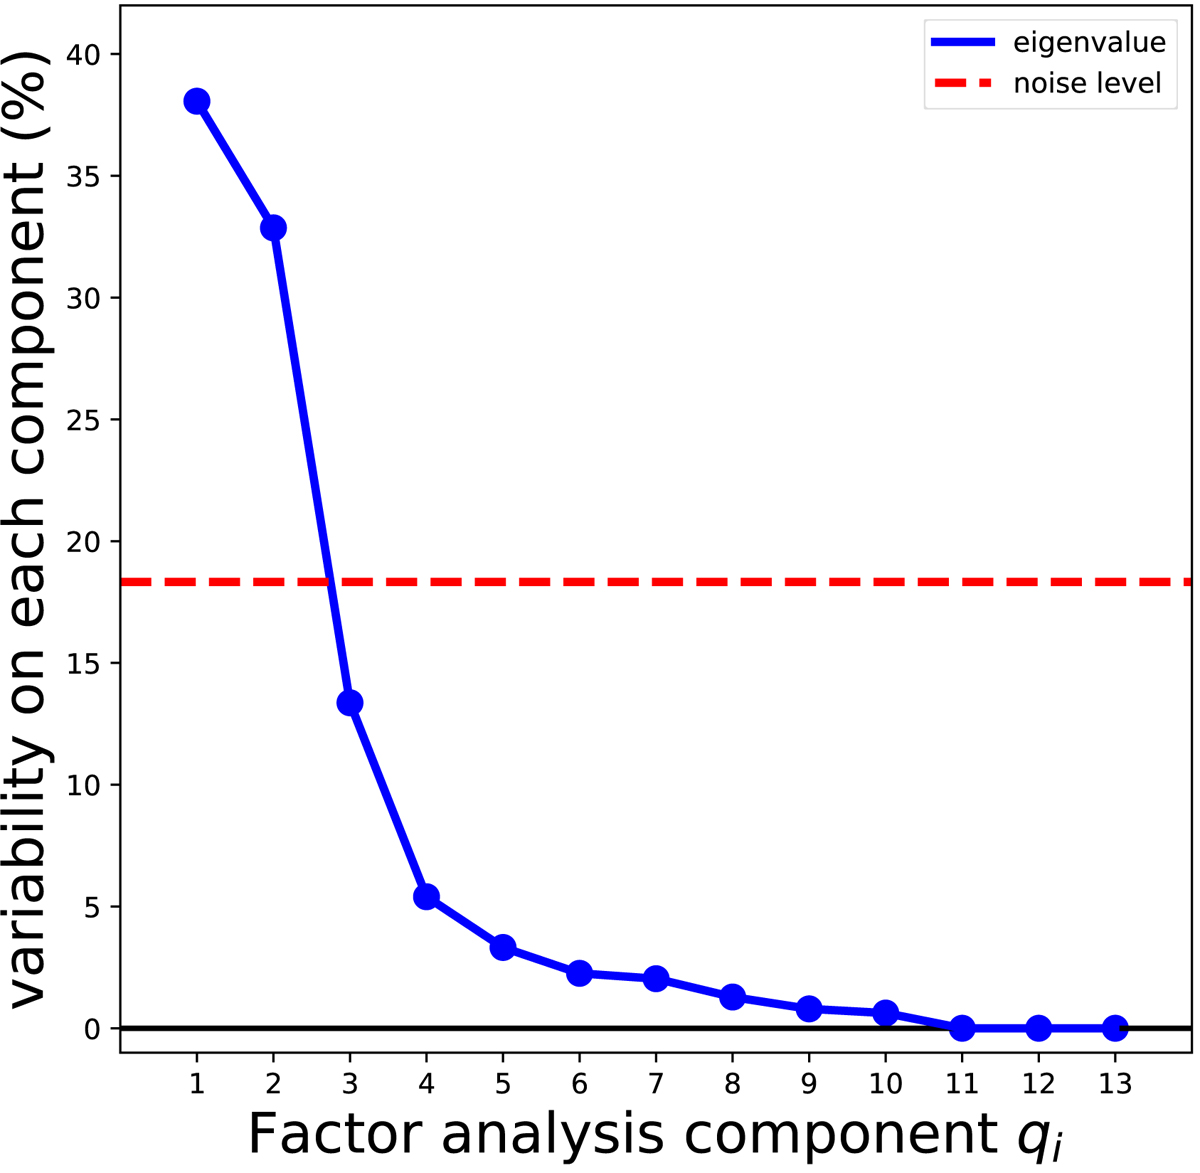
Relative importance of the eigenvalues associated with the eigenvectors. They are ordered in decreasing order of variance, and the total amounts to 100% once the contribution of the noise (indicated by a red line) is taken into account. We can see that the first three vectors dominate the variability of this space.
Current usage metrics show cumulative count of Article Views (full-text article views including HTML views, PDF and ePub downloads, according to the available data) and Abstracts Views on Vision4Press platform.
Data correspond to usage on the plateform after 2015. The current usage metrics is available 48-96 hours after online publication and is updated daily on week days.
Initial download of the metrics may take a while.