Open Access
Fig. 19.
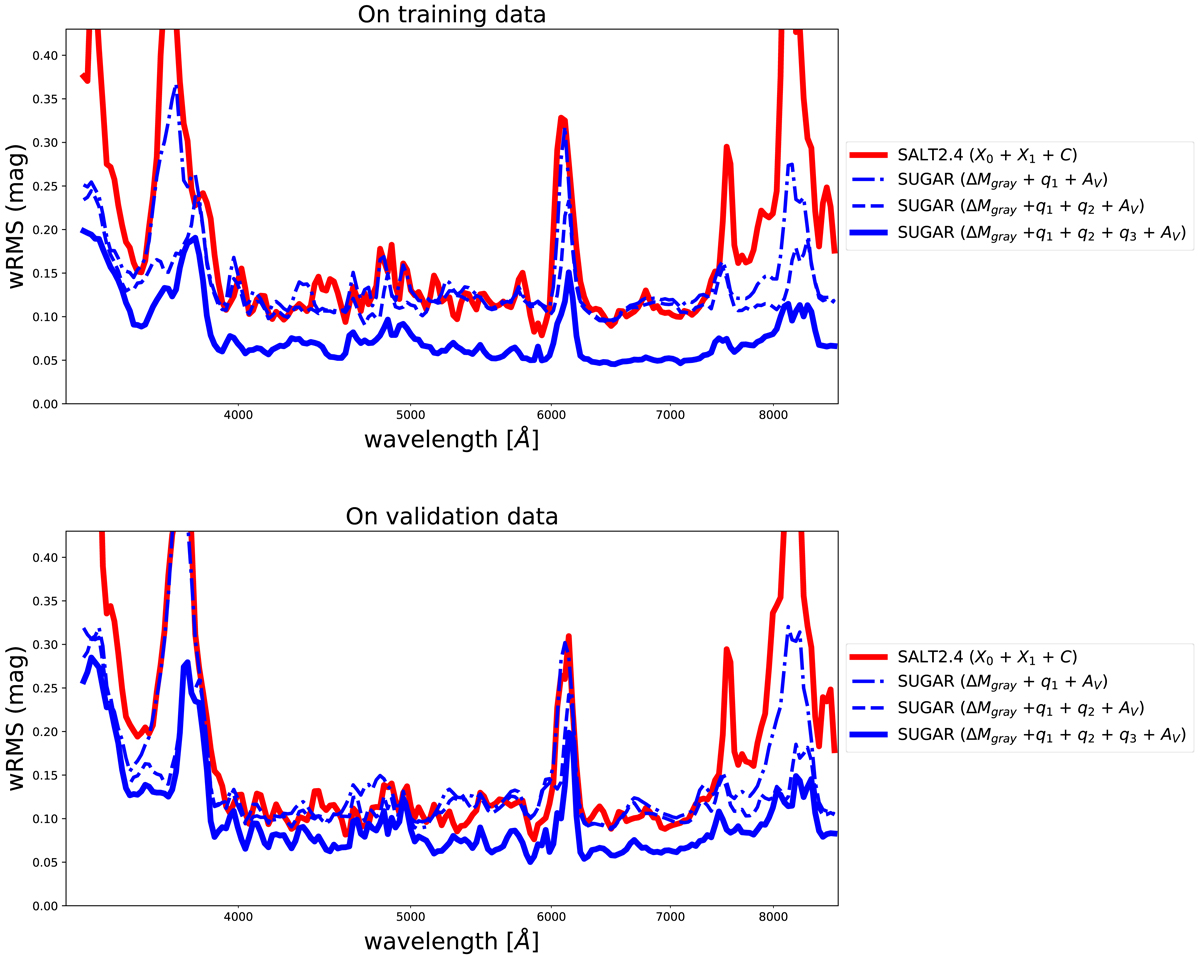
wRMS of the residuals as a function of the wavelength for the full SUGAR model (blue line), for the SUGAR model only corrected by q1 and AV (blue dashed dotted line), for the SUGAR model only correct by q1, q2 and AV (blue dashed lines), and for the SALT2 model (red line). Top: training data. Bottom: validation data.
Current usage metrics show cumulative count of Article Views (full-text article views including HTML views, PDF and ePub downloads, according to the available data) and Abstracts Views on Vision4Press platform.
Data correspond to usage on the plateform after 2015. The current usage metrics is available 48-96 hours after online publication and is updated daily on week days.
Initial download of the metrics may take a while.