Open Access
Fig. 1.
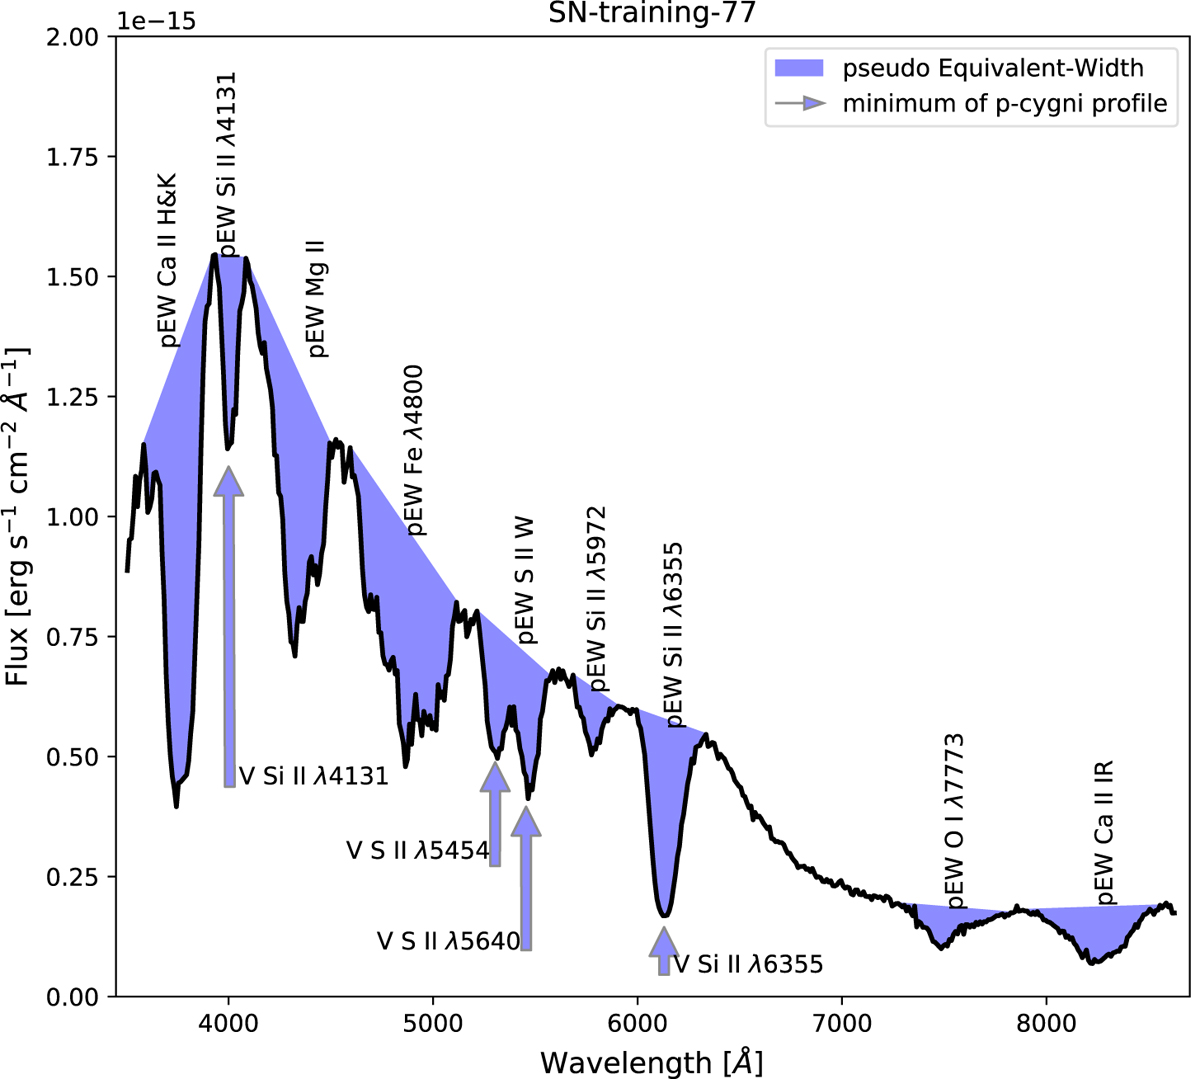
Pseudo-equivalent widths of absorption lines at maximum light as well as minima of P-Cygni profiles at maximum of light which are used in our analysis. They are represented on the spectrum of SN-training-77 at a phase of 1 day after maximum brightness.
Current usage metrics show cumulative count of Article Views (full-text article views including HTML views, PDF and ePub downloads, according to the available data) and Abstracts Views on Vision4Press platform.
Data correspond to usage on the plateform after 2015. The current usage metrics is available 48-96 hours after online publication and is updated daily on week days.
Initial download of the metrics may take a while.