Fig. A.1.
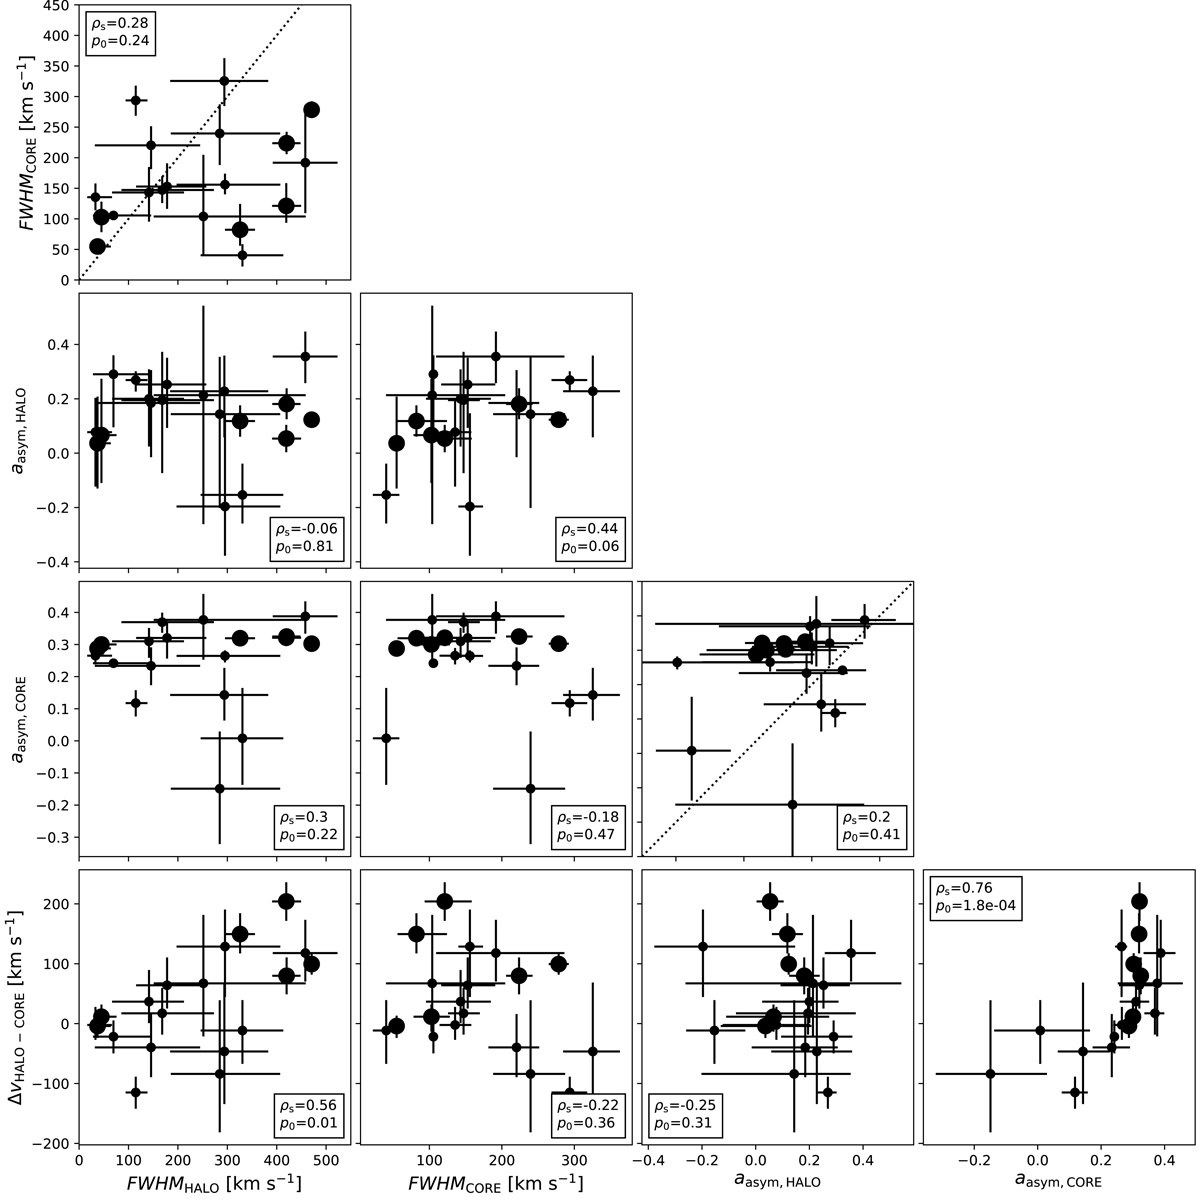
Relations between the line parameters resulting from our 3D fit procedure (see Sect. 4.1.3). The larger symbols indicate the six S/NHALO > 10 objects. Spearman rank correlation coefficients ρs and corresponding p0 values are shown in each panel. The dotted lines represent the one to one relation. The first and last panels of the bottom row are also displayed in Fig. 7.
Current usage metrics show cumulative count of Article Views (full-text article views including HTML views, PDF and ePub downloads, according to the available data) and Abstracts Views on Vision4Press platform.
Data correspond to usage on the plateform after 2015. The current usage metrics is available 48-96 hours after online publication and is updated daily on week days.
Initial download of the metrics may take a while.