Fig. A.1.
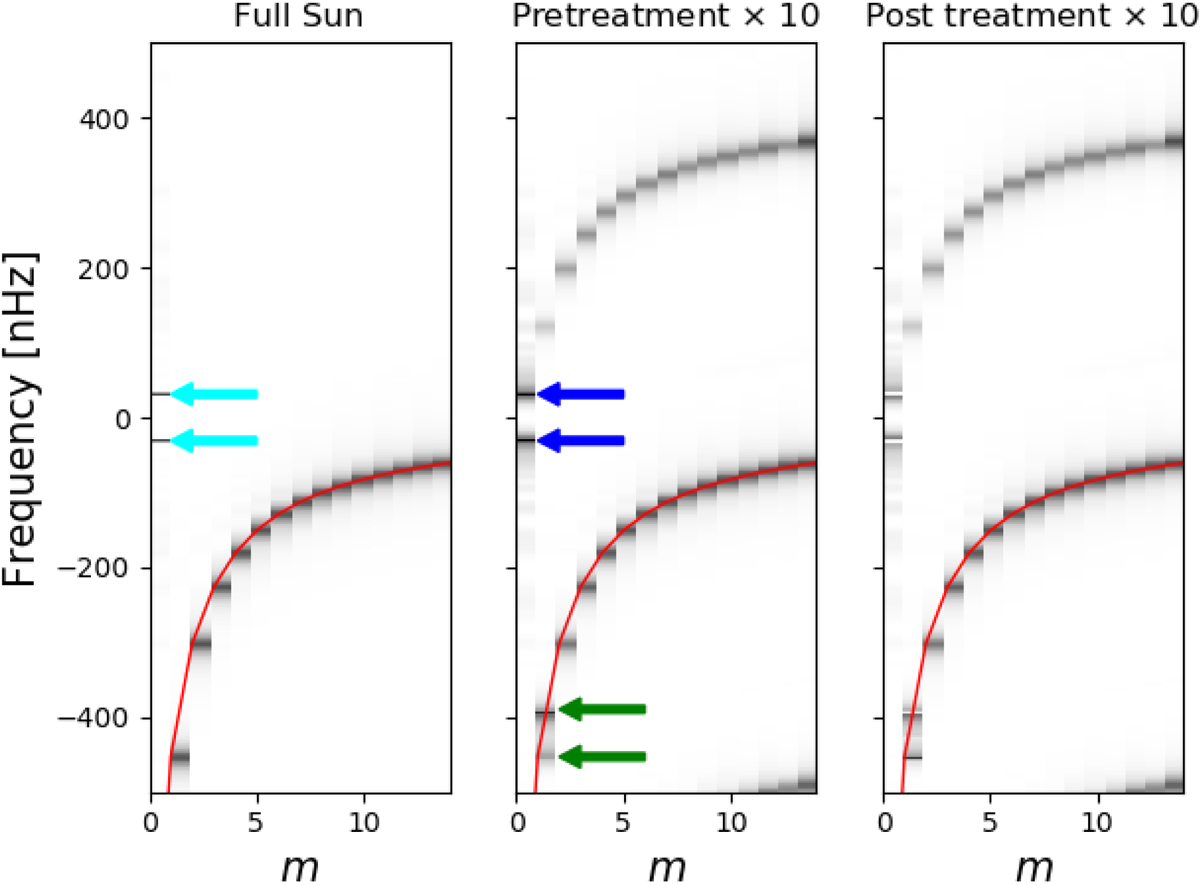
Sectoral power spectra for the synthetic radial vorticity data for the complete solar surface (full Sun, left panel), including the observational window function (pre-treatment, central panel), and after processing (post-treatment, right panel). Cyan arrows show the peaks at ±(1 year)−1 = ±31.7 nHz. Blue arrows show the leakage of |m| = 1 into m = 0 once the window function is applied. These leakages coincide with the annual variation. After treatment, the annual variation and its leakage disappears, leaving the m = 1 r-modes and associated leakage. The green arrows highlight the effects the window has on m = 1 power.
Current usage metrics show cumulative count of Article Views (full-text article views including HTML views, PDF and ePub downloads, according to the available data) and Abstracts Views on Vision4Press platform.
Data correspond to usage on the plateform after 2015. The current usage metrics is available 48-96 hours after online publication and is updated daily on week days.
Initial download of the metrics may take a while.