Fig. 1.
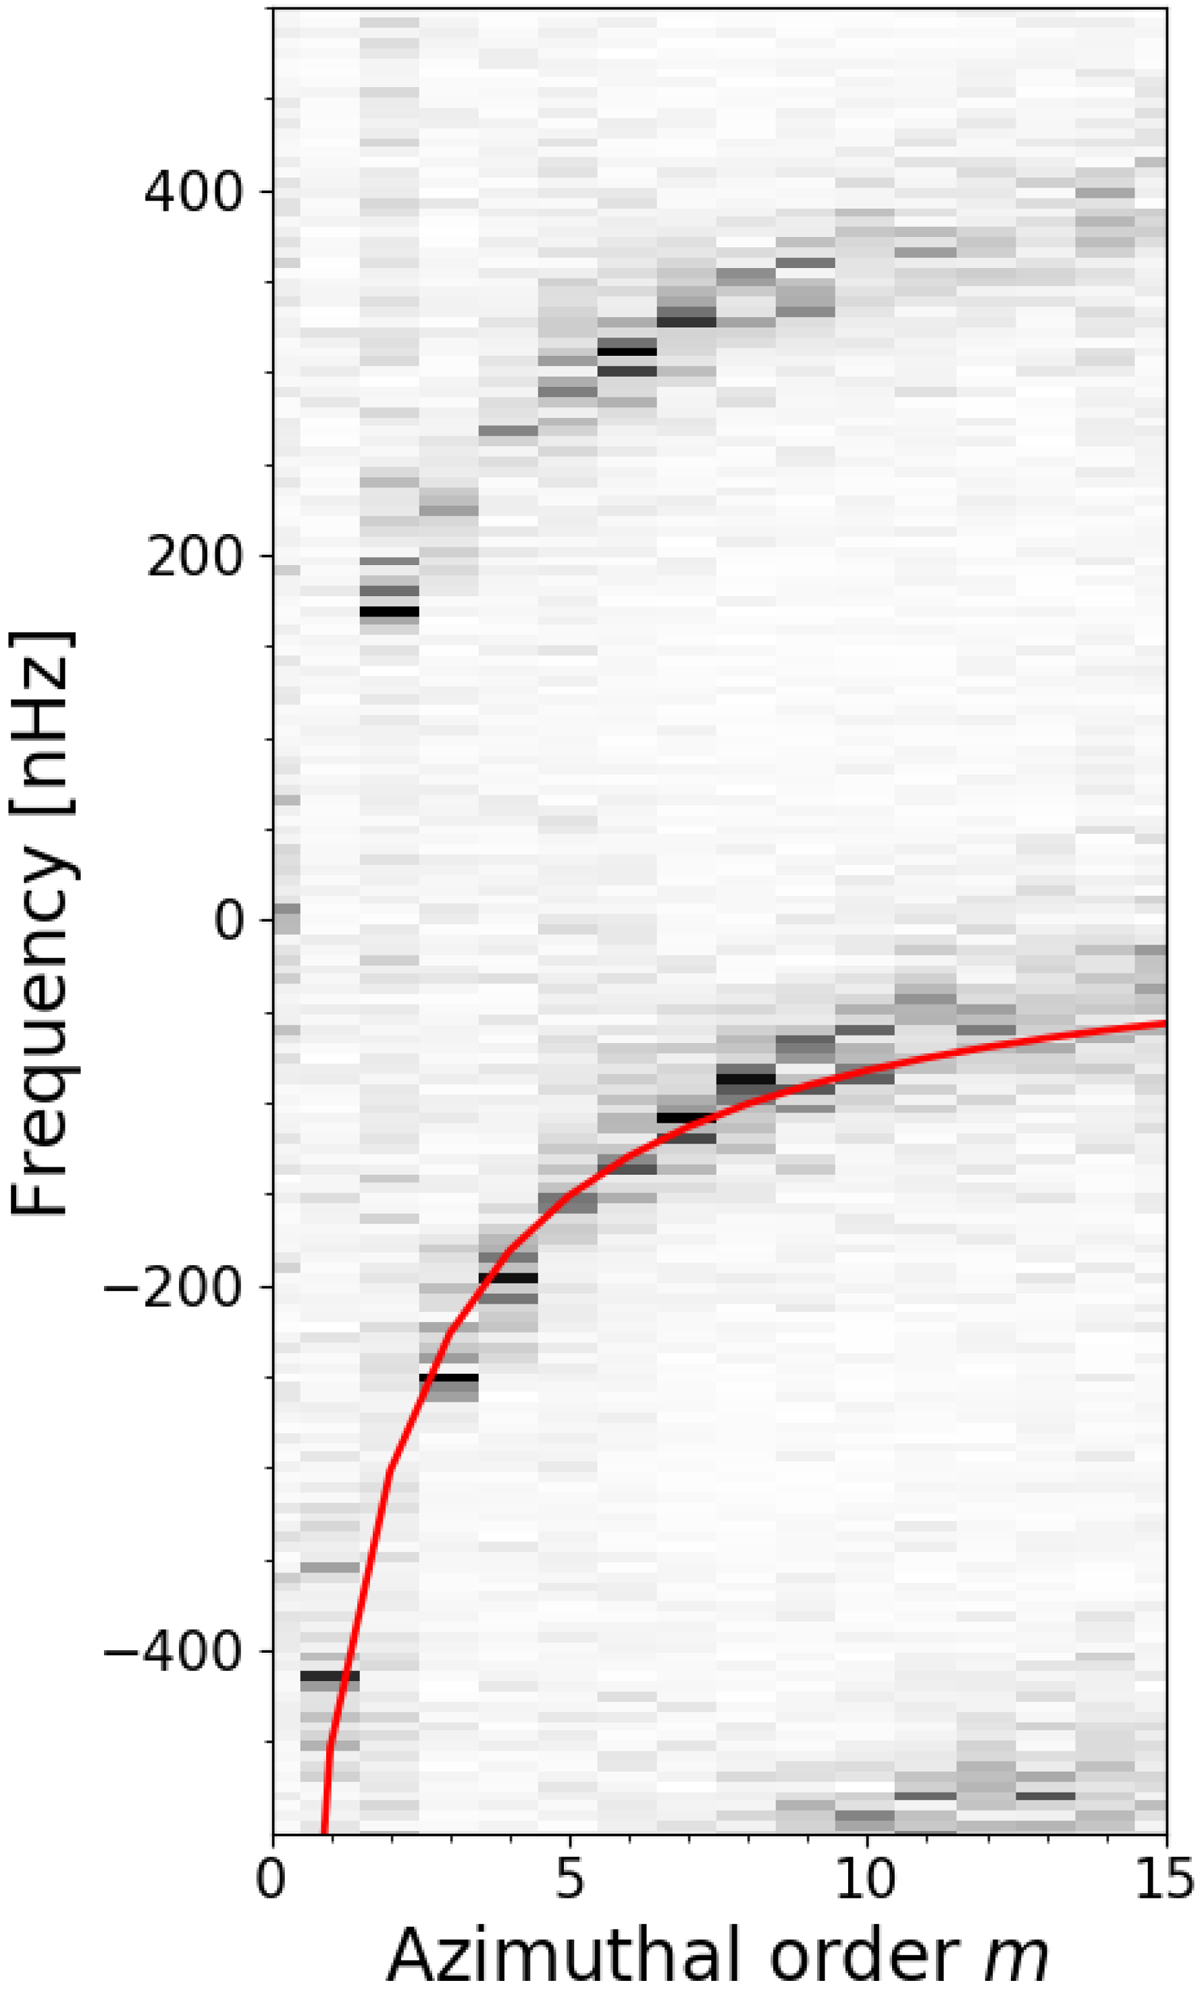
Sectoral power spectrum of the radial vorticity computed from 17.42 years of GONG++ RDA data starting 4 September 2001. Each m is normalized to the mean power between −500 and 100 nHz. For clarity we plot the power spectrum rebinned by a factor of three in frequency. The red line shows the theoretical dispersion relation for sectoral Rossby waves given in the text. While a m = 1 r mode seems to be present, it is likely low-frequency power leaked from m = 0.
Current usage metrics show cumulative count of Article Views (full-text article views including HTML views, PDF and ePub downloads, according to the available data) and Abstracts Views on Vision4Press platform.
Data correspond to usage on the plateform after 2015. The current usage metrics is available 48-96 hours after online publication and is updated daily on week days.
Initial download of the metrics may take a while.