Fig. B.1.
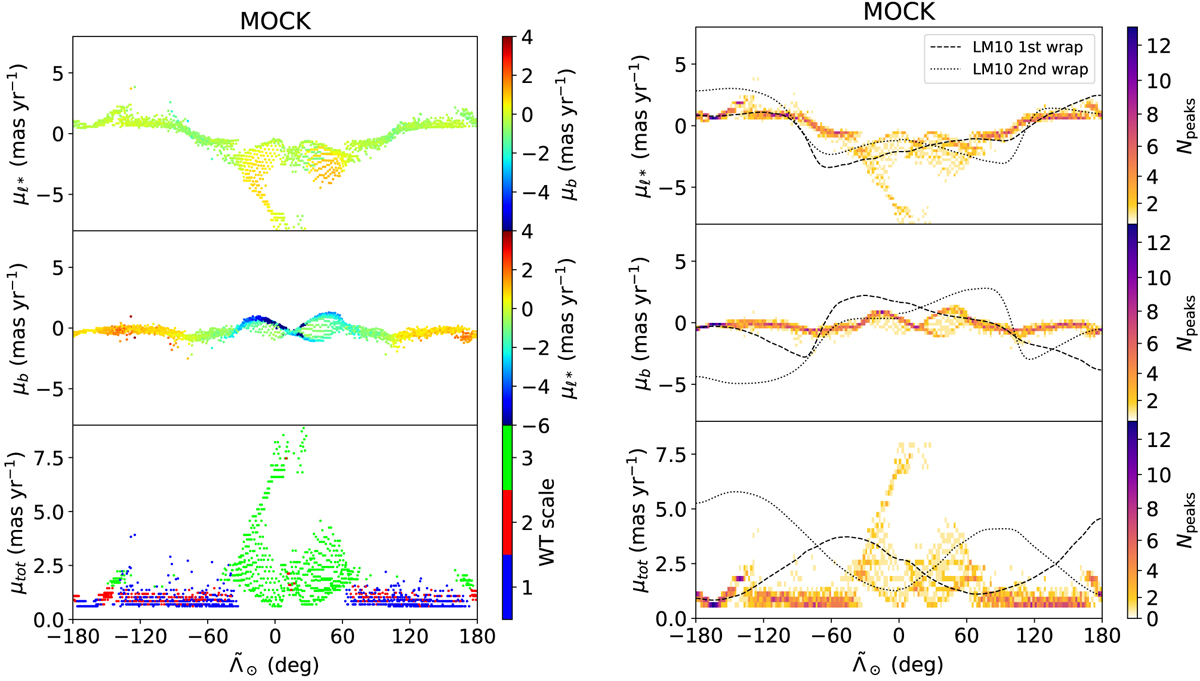
Peaks detected in the mock Gaia catalog with no Sgr stream. Left: proper motions of the peaks as a function of ![]() (top: proper motion in Galactic longitude, middle: in latitude, bottom: total proper motion) color coded by proper motion in latitude (top), in longitude (middle), and by WT scale (bottom). Right: same as in the left panel but in a 2D histogram with the LM10 model superposed with black lines.
(top: proper motion in Galactic longitude, middle: in latitude, bottom: total proper motion) color coded by proper motion in latitude (top), in longitude (middle), and by WT scale (bottom). Right: same as in the left panel but in a 2D histogram with the LM10 model superposed with black lines.
Current usage metrics show cumulative count of Article Views (full-text article views including HTML views, PDF and ePub downloads, according to the available data) and Abstracts Views on Vision4Press platform.
Data correspond to usage on the plateform after 2015. The current usage metrics is available 48-96 hours after online publication and is updated daily on week days.
Initial download of the metrics may take a while.