Fig. A.1.
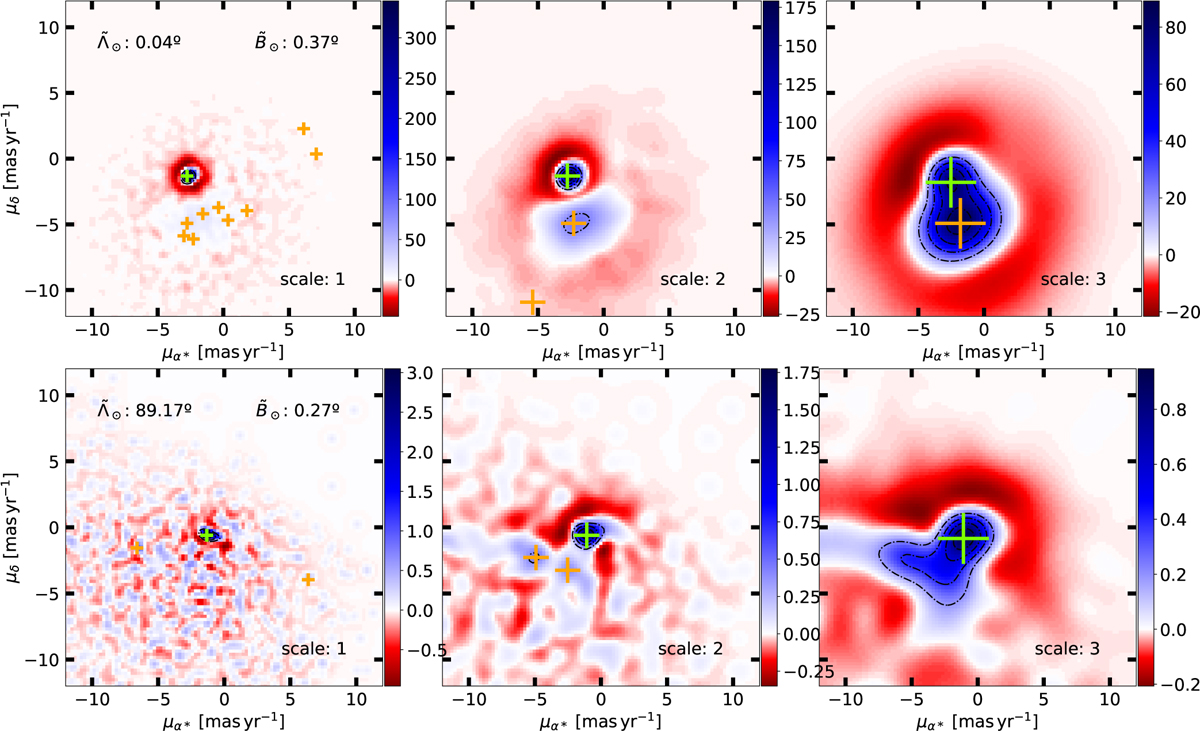
Example of WT planes in two different HEALpix fields corresponding to the Sgr core (top row) and the middle part of the leading arm (bottom) at the three different scales analyzed here (three columns, from left to right for small to large). The color indicates the value of the WT coefficients, where darker blue means higher WT, i.e., higher intensity of the substructure, while red colors are for under-dense regions. Crosses are peaks detected in these WT planes. The peak of the Sgr stream/dwarf is marked in green and appears to be well separated from the general field.
Current usage metrics show cumulative count of Article Views (full-text article views including HTML views, PDF and ePub downloads, according to the available data) and Abstracts Views on Vision4Press platform.
Data correspond to usage on the plateform after 2015. The current usage metrics is available 48-96 hours after online publication and is updated daily on week days.
Initial download of the metrics may take a while.