Fig. 2.
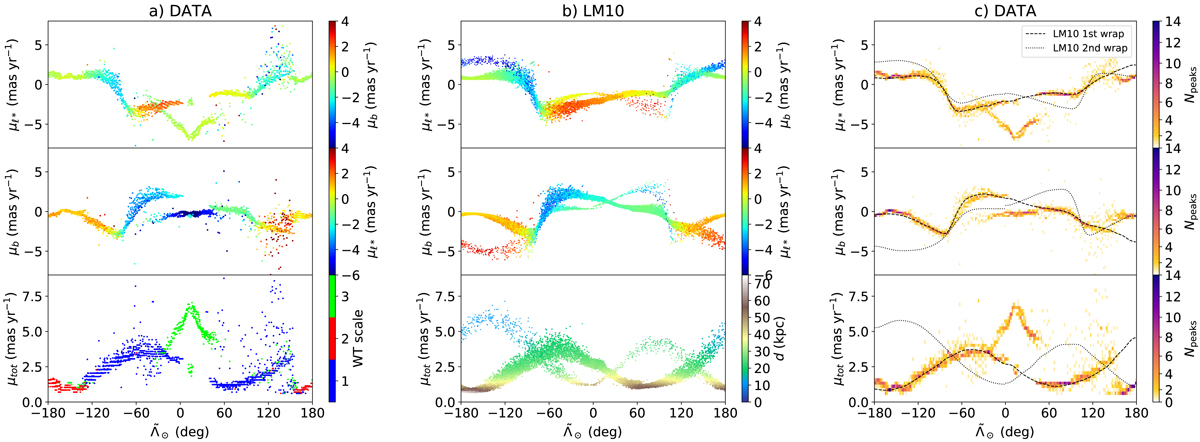
Proper motion of the Sgr stream from the Gaia data and comparison with the LM10 model. All panels show the proper motion in Galactic longitude in the top, in latitude in the middle, and total in the bottom, as a function of ![]() . (a) Proper motions of the detected peaks color coded by proper motion in latitude (top), in longitude (middle), and in WT scale (bottom). (b) Same but for the model and the bottom panel colored by distance to the Sun. The second wrap of the model has been given more transparency to enhance the contrast of the first wrap. (c) Same as (a) but represented by a 2D histogram with the trace of the model superposed in black dashed (first wrap) and dotted (second wrap) lines.
. (a) Proper motions of the detected peaks color coded by proper motion in latitude (top), in longitude (middle), and in WT scale (bottom). (b) Same but for the model and the bottom panel colored by distance to the Sun. The second wrap of the model has been given more transparency to enhance the contrast of the first wrap. (c) Same as (a) but represented by a 2D histogram with the trace of the model superposed in black dashed (first wrap) and dotted (second wrap) lines.
Current usage metrics show cumulative count of Article Views (full-text article views including HTML views, PDF and ePub downloads, according to the available data) and Abstracts Views on Vision4Press platform.
Data correspond to usage on the plateform after 2015. The current usage metrics is available 48-96 hours after online publication and is updated daily on week days.
Initial download of the metrics may take a while.